

The past three months in the gold market have been among the most dramatic in recent memory. Having climbed to an all-time record high of $5,595 per troy ounce on January 29, 2026, gold subsequently entered a sharp corrective phase, shedding close to 19 percent of its value before finding support. As of May 29, 2026, COMEX Gold Futures (GC1!) trade at $4,561 per ounce up 1.59% on the day — while XAU/USD spot trades at $4,540.53, still representing a gain of around 37% over the prior twelve months.
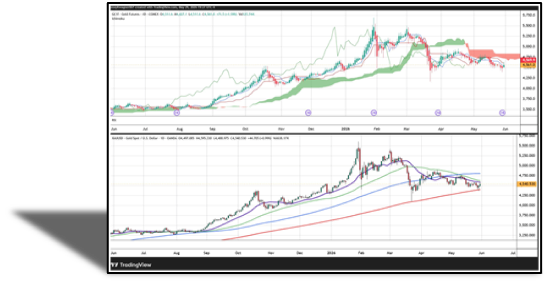
On the daily charts below the upper panel showing August Gold Futures in Heiken Ashi format with an Ichimoku Cloud overlay, the lower showing spot gold in standard candlestick format with multiple moving averages (20-day EMA, 50,100,200-day SMA) the current state of the market is easily identified.
The upper panel tells a clear story of regime change. From June through December 2025, price action was consistently above the Ichimoku Cloud, which expanded bullishly — a textbook confirmation of a strong uptrend. The parabolic extension to above $5,500 carried price far ahead of the cloud, a classic sign of unsustainable momentum. Price has now crossed below the cloud, which has rotated from bullish green to bearish red in the near-term projection window. The Tenkan-sen/Kijun-sen dead cross in late January confirmed the regime shift. The cloud at $4,750–$4,770 is the key resistance bulls must reclaim.
The lower panel reinforces this. XAU/USD trades below both its 20-day moving average (~$4,620) and 50-day moving average (~$4,750). However, price remains well above the long-term uptrend moving average (the red line rising from ~$3,250), which has provided support throughout the entire bull run — and was not broken even at the March lows.
Record High and Rapid Reversal
Gold entered 2026 with exceptional momentum. Central banks purchased a record 1,237 tonnes in 2025 — the third consecutive year above 1,000 tonnes — and the metal set 53 new all-time highs last year, closing at $3,431 per ounce, a 44 percent annual average increase. Two catalysts drove the subsequent correction: the nomination of a hawkish Fed chair candidate, which strengthened the dollar and triggered profit-taking; and the Strait of Hormuz blockade pushing oil above $100 per barrel, driving March CPI to 3.3% year-on-year. Elevated inflation locked the Federal Reserve in place and removed the rate-cut premium embedded in gold's price. North American ETFs recorded over $12.7 billion in outflows in March alone — the largest monthly redemption in at least five years.
March to May: Finding a Floor
Gold's trough came mid-March at ~$4,098, visible on both charts as a decisive spike low immediately followed by recovery — and critically, one that held above the long-term trend support line. Price recovered to $4,792 by mid-April, driven by renewed institutional demand and persistent sovereign buying, most notably from Asian central banks. US-listed gold ETFs posted net inflows of $0.83 billion in April, partially reversing the prior month's outflows. May has seen gold range between $4,453 and $4,773. A fresh US-Iran flare-up on May 28 dragged spot to $4,380, but today's in-line April PCE print of 3.8 percent sparked recovery — GC1! closing up $71.50, producing the strong bullish session visible at the right edge of both charts.
Structural Case Remains Intact
While cyclical headwinds — high real yields, reduced rate-cut expectations, dollar resilience — have weighed on gold, the structural supports have not deteriorated. The World Gold Council projects central bank purchases of 750–850 tonnes in 2026. Key buyers include China, India, Turkey, Poland, and Singapore, with Saudi Arabia and the UAE exploring significant new allocations. US fiscal dynamics remain a long-term positive: net interest expense is on a trajectory to exceed $1 trillion; the defense budget request stands at ~$1.5 trillion, and global sovereign debt has surpassed $348 trillion — all reinforcing the debasement narrative that has underpinned gold's multi-year bull run.
Technical Roadmap and Key Risks
Bulls need a daily close above the Ichimoku Cloud ($4,750–$4,770) to signal regime restoration. Beyond that, a reclaim of $5,000 would likely attract systematic fund buying. To the downside, failure to hold $4,441 could invite a deeper correction toward $4,159, though both levels remain well above long-term trend support. On the fundamental side, a hawkish Fed pivot remains the primary headwind; any easing of Middle East tensions could remove safe-haven premium. Conversely, a ceasefire leading to oil normalization would create CPI relief and reopen the door for rate cuts directly removing the opportunity-cost pressure that has most constrained Western demand this quarter.
The three months from late February to end of May 2026 illustrate both the power and the limits of gold in the current macro environment. The 19% correction was driven by identifiable, rational forces captured precisely in the Ichimoku cloud reversal and the breakdown below short-term moving averages. Yet the long-term uptrend support on the XAU/USD panel, rising unbroken since 2024, has not been tested. Sovereign buyers have continued to accumulate on weakness. The current $4,400–$4,800 consolidation zone may well prove to be a strategic accumulation window. The bull cycle's structural foundations remain intact and the market's ability to absorb a near $1,200 correction without breaking its multi-year trend suggests the story is far from over.
For those that would like more information about our services click here.
Wishing you as always good trading,
