
Strengths
- The best performing precious metal for the week was palladium, up 6.23%. Palladium rallied alongside gold, silver, and platinum after softer U.S. jobs data pointed to slowing economic momentum, boosting demand for precious metals as stores of value. With weaker payroll growth reviving expectations for Fed rate cuts and weighing on the dollar, palladium is benefiting as investors rotate into hard assets to hedge against a softer growth backdrop.
- Gold and the rest of the precious metals got an extra lift on Friday when Change in Nonfarm Payrolls came in at only 57K vs expectations of 113K. In addition, the prior two monthly reading were revised down, which previously showed a rising trend in hiring which could be inflationary if the economy is heating up. The weaker numbers give the Fed some reason to pause considering a rate hike at their next meeting.
- Heraeus reported that China imported 162.6 metric tons of gold in May, up from 99.5 metric tons in May 2025, representing a 63% year-over-year increase. Year-to-date, China's non-monetary gold imports total 691.6 metric tons, up 76% from 393.6 metric tons during the January–May period last year, although still below the 840.6 metric tons imported during the same period in 2024.
Weaknesses
- The worst performing precious metal for the week was platinum, still up 0.75%. Platinum also advanced alongside its precious metals peers on the soft jobs data, but its move lagged the sharper gains in gold, silver and especially palladium pointing to more tepid participation. That relative underperformance suggests the marginal buyer has yet to fully return to platinum, even as the broader rate-cut narrative lifts the complex.
- Exchange-traded funds cut 403,509 troy ounces of gold from their holdings in a recent trading session, bringing this year's net sales to 2.21 million ounces, according to data compiled by Bloomberg. This was the biggest one-day decrease since March 4.
- According to BMO, Silvercorp announced that it has temporarily suspended operations at its Ying and GC mines in China to ensure compliance with new nationwide safety regulations. Production is expected to decline 40-50% at Ying from July to September 2026, with a 10-15% impact in the current quarter, leading to an overall reduction to its NAV of 1.4%.
Opportunities
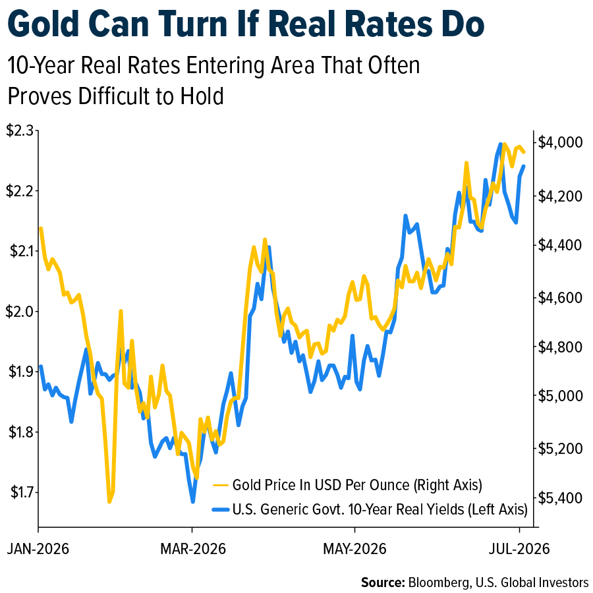
- Real interest rates have moved higher since the conflict with Iran began, coinciding with the appointment of a new Fed chair whom some investors view as more hawkish on inflation. However, Bloomberg's Brendan Fagan noted that 10-year real yields have repeatedly struggled to break above 2.2% in the post-pandemic period, helping gold stabilize around $4,000. Fed Chair Warsh also struck a more constructive tone midweek, noting that inflation risks have eased in recent weeks while expressing optimism about AI's potential to boost productivity. If real yields have peaked in the near term, gold may have established a durable price floor.
- According to Scotiabank, every $100 per ounce increase in the gold price raises resource ounces by approximately 4%. With gold averaging about $4,700 per ounce year-to-date, which would bring the three-year average to roughly $3,500 per ounce, the firm expects higher reserve and resource price assumptions at year-end 2026. Scotiabank also highlighted that gold producers currently trade at an average P/E ratio of approximately 11x—the lowest level relative to history since its data series began in 1985. By comparison, the S&P 500 trades at roughly 25x earnings and the Nasdaq at approximately 34x, suggesting gold mining stocks remain attractively valued despite the strong rally in gold prices over the past four years.
- Gold's 50-day moving average is approaching a crossover below its 200-day moving average, a technical pattern known as a "death cross." However, historical data suggest the signal has not consistently been bearish. According to Bloomberg, of the 28 death crosses recorded since January 1981, gold prices were higher one month later 57% of the time, higher six months later 57% of the time, and higher one year later 46% of the time.
Threats
- India’s restrictions on gold imports are projected to reduce the country’s demand for the yellow metal by about 10% year over year, according to a World Gold Council report. Demand for gold jewelry, bars, and coins is expected to decline by 50–60 tons year over year due to the import duty hike alone, World Gold Council analysts wrote, citing their econometric analysis.
- According to Goldman Sachs, over the past 3–5 years the capital intensity of building Australian gold projects has roughly doubled across both greenfield and brownfield developments, with rising costs for processing mills being a key driver. Despite this increase, they note that it remains generally more attractive to build than acquire assets, as higher gold prices through the cycle continue to outpace cost and capital expenditure inflation.
- UBS believes rising cost pressures in the gold sector remain underappreciated by the market. While consensus assumes costs have peaked, they expect sector-wide all-in sustaining costs (AISC) to rise by approximately A$110 per ounce year over year in FY27, leading to roughly 5% EPS downside and continued margin compression. While gold is facing near-term pressure from higher yields and shifting rate expectations, UBS maintains a constructive longer-term outlook supported by potential Fed easing and ongoing diversification demand, though the timing of price recovery may be more uncertain.
