

Markets finally gave us something new to work with.
Several key assets either broke important technical levels or started testing them, shifting the short-term technical picture. The next few daily closes will likely determine whether these moves develop into lasting trends or turn into failed breakouts/breakdowns.
Dollar (DX.F)
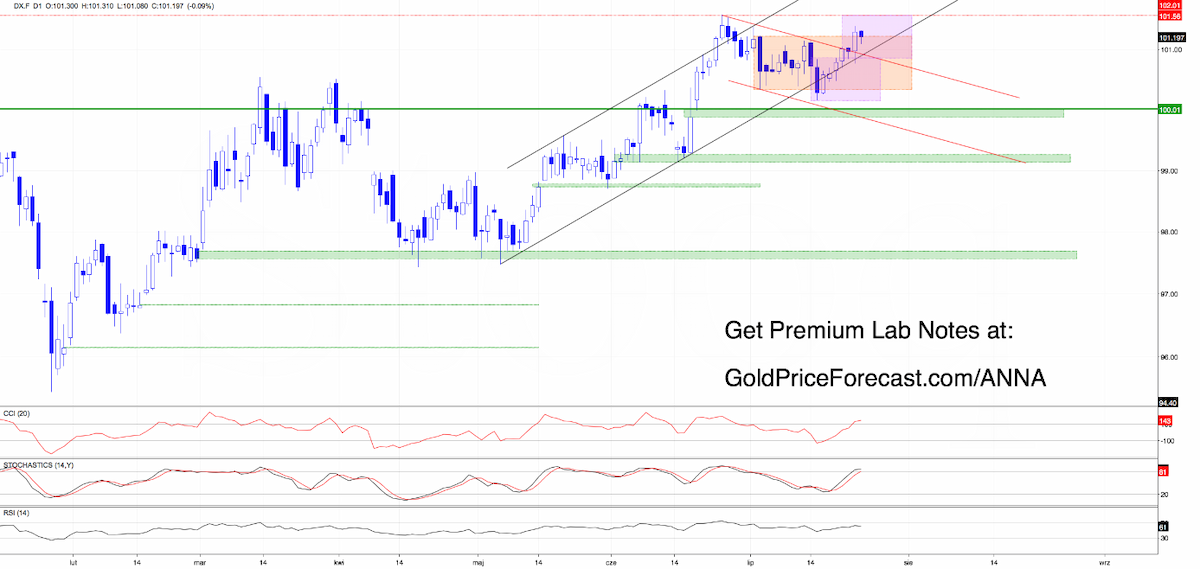
The biggest change on the daily chart is yesterday's close above the upper boundary of the orange consolidation at 101.21. That breakout also invalidated two bearish engulfing patterns, giving the bulls an important technical advantage.
Today's session brought a modest pullback, but from a technical perspective nothing has changed. As long as the dollar continues closing above 101.21, yesterday's bullish breakout remains valid and yesterday's upside targets stay in play.
Palladium (PA.F)
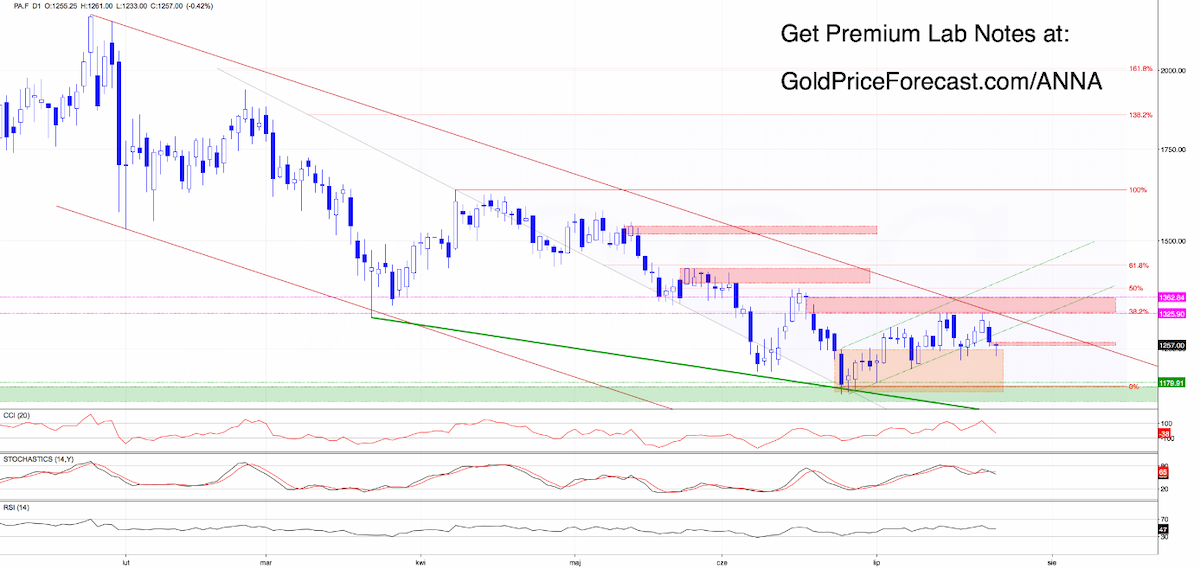
Yesterday, we wrote the following:
“(…) palladium dropped back below the lower boundary of the green ascending channel.
What happens next?
If today's session closes below that support, the 1250 area comes back into play.(…)”
Looking at the daily chart, we see that today's price action developed exactly in line with yesterday's bearish scenario.
Today's Asian session opened another bearish gap (1255-1262), which triggered a test of the above-mentioned support around 1250. At the moment of writing these words, price remains below this resistance zone, keeping sellers firmly in control.
Therefore, in our opinion, as long as palladium continues closing below the previously broken lower boundary of the green rising channel, every bounce should be treated as another verification of yesterday's breakdown.
The bearish case is also supported by fresh daily sell signals generated by the indicators, keeping yesterday’s downside scenario toward 1180 alive.
Copper (HG.F)
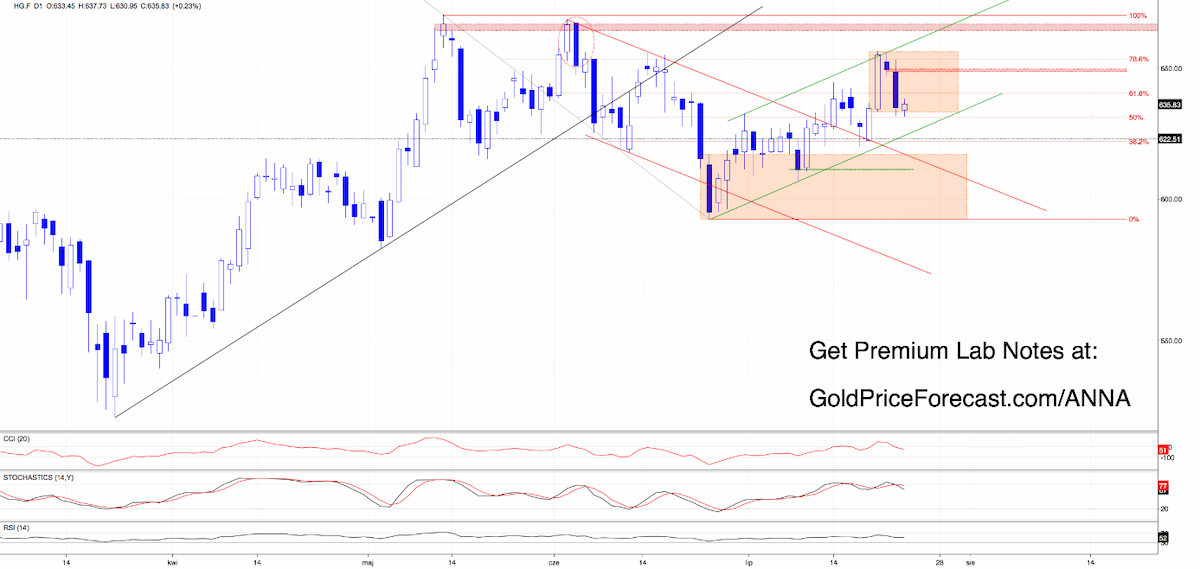
Copper also continues to follow yesterday's roadmap. As a reminder:
“(…) At the moment, price is still trading inside the consolidation formed by Tuesday's wide bullish candle (632-656), which suggests that a test of the lower boundary of the pattern may be just around the corner.(…)”
From today’s perspective, we see that sellers successfully tested the lower boundary of the mentioned consolidation, but Thursday's session still finished inside the range, which means that yesterday’s tiny breakdown was invalidated.
Therefore, we believe that only a daily close below 632 would officially trigger the next bearish leg and reopen the path toward yesterday's downside targets.
Adding to the bearish picture, both CCI and Stochastic generated fresh daily sell signals, giving bears additional technical arguments.
Today's Takeaways
Dollar (DX.F)
- Watch 101.21.
- As long as the dollar holds above this level on a daily closing basis, the bullish breakout remains valid.
- A move above the recent highs keeps 102.00-102.10 and 102.41-102.50 in focus.
- A daily close below 101.21 would weaken a bit the bullish scenario.
Palladium (PA.F)
- Watch the 1255-1262 resistance zone & (1280) lower line of the green rising channel
- As long as price remains below them, sellers stay in control.
- A daily close back above the broken channel would be the first sign that bearish momentum is fading.
Copper (HG.F)
- Watch 632.
- A daily close below this level confirms the breakdown and opens the way toward the next downside targets.
- The next important support sits near 622.50, at the lower boundary of the green rising channel.
Wait for confirmation, protect your capital, and stay one step ahead.
Anna
