

(Kitco Commentary) - It was a week that began with gold in full momentum mode and ended with a sobering reminder that no rally is immune to the Fed's reach. What started as a seven-session streak of consecutive higher highs — with gold clearing the 38.2% Fibonacci retracement at $4,692 and briefly eyeing the 50% level at $4,900 — came undone in a single session Friday as Fed Chairman Kevin Warsh delivered a more hawkish-than-expected keynote address at the Jackson Hole Economic Symposium, sending December gold futures plunging $150.70, or 3.24%, to close at $4,504.10.
Let's walk through the week step by step, because context matters here.
Monday set the tone impressively. Gold advanced $48 in futures markets, clearing the 38.2% Fibonacci level at $4,692 with conviction. Having previously absorbed the 23.6% Fibonacci level and both the 100 and 200-day moving averages without meaningful resistance, the technical chart was in excellent shape. The path to $4,900 appeared unobstructed, and we outlined exactly that in Monday's commentary.
Tuesday brought gold to a new three-month high — the seventh consecutive higher high on the daily candlestick chart — before the market settled into an almost perfect doji candle in the star position. As noted at the time, this was a market evenly balanced between buyers and sellers, pausing for breath directly ahead of Jackson Hole. The doji in the star position was a yellow flag worth monitoring.
Wednesday's session began to show the first real cracks, though not from inside the gold market itself. A hotter-than-expected Personal Consumption Expenditures report for July — with the headline PCE rising 0.2% against a consensus expectation of 0.1%, and the annual rate printing at 3.7% — strengthened the dollar and pressed gold lower. That session completed the three-river evening star candlestick pattern flagged as a possibility earlier in the week.
Gold held, however, right at the 200-day simple moving average — a level repeatedly identified as meaningful support — and that hold kept the bullish case very much alive.
Thursday appeared to confirm the bulls had weathered the storm. Despite a $68 pullback completing the evening star, gold held above the 200-day moving average. The assessment at the time was that the pullback had very likely run its course, and that the entry points outlined over the prior weeks remained among the best available. Meanwhile, Bitcoin crossed above $80,000 for the first time in over 100 days — crypto markets, with their lower margin requirements and 24-hour nature, were simply leading where gold and silver would follow. The fundamental thesis remained fully intact going into Friday.
Friday was a different story.
The Jackson Hole speech delivered the blow. Gold opened at $4,656, briefly tagged a session high of $4,688 — testing and failing to reclaim the former support at the 38.2% Fibonacci level of $4,692 — and then sold off sharply, closing at $4,504.10, down $150.70 on the session. The weekly gain was entirely erased, and then some.
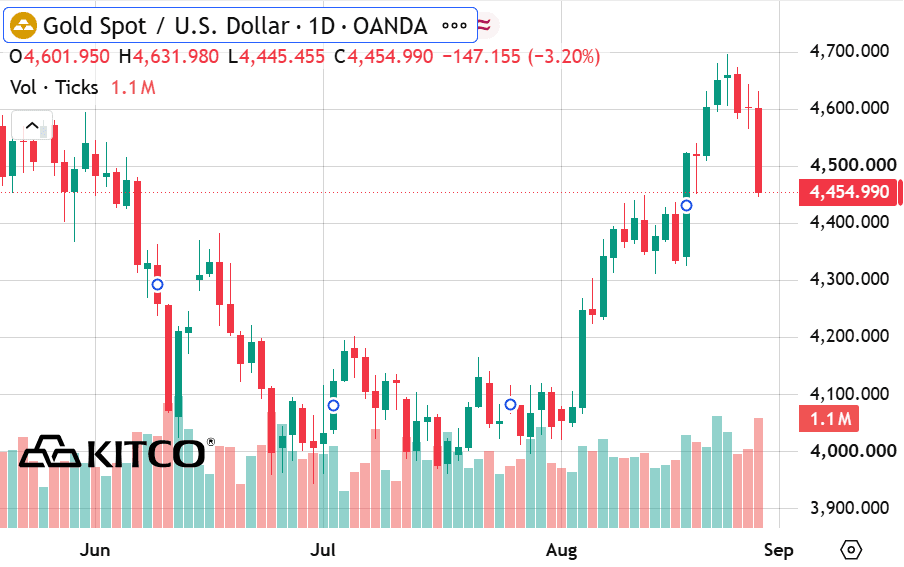
What does the technical damage look like now? Gold has closed back below the 200-day moving average, currently sitting at $4,641.20, which now reverts to overhead resistance. The close at $4,504 places price directly at the Ichimoku Lagging Span, with the Ichimoku cloud just below — Leading Span A comes in at $4,485.50, and Leading Span B at $4,385.30. The cloud itself now becomes the critical battleground going into next week. If gold can find footing here and hold within or above the cloud, the broader bullish structure remains arguable.
A close below $4,435 — the 23.6% Fibonacci retracement — would be a more serious technical warning and shift the conversation toward a retest of lower levels. The MACD remains in positive territory with a reading of 7.4 on the line and 107.8 on the signal, though the histogram has been meaningfully dented and deserves close attention in the sessions ahead.
Despite Friday's sharp decline, it would be premature to abandon the broader thesis. Gold has been advancing for legitimate fundamental reasons — a $40 trillion national debt, sticky inflation, and a Fed whose room to maneuver grows narrower by the quarter. One sharp session does not unwind those dynamics. What it does do is reset the technical picture and demand that bulls prove themselves again at the next key test. Whether that test comes at the Ichimoku cloud, the 23.6% Fibonacci level, or somewhere in between will shape the setup heading into September.
Our targets remain unchanged: $4,692 must be reclaimed for the near-term risk-reward to shift back in the bulls' favor, and $4,900 remains the medium-term objective within the next 30 to 60 days. Silver, which continues to lag the broader move, bears watching as well — when it finally moves, it tends to make everything else look slow. The road to those targets just got a little bumpier, but the destination has not changed.
Wishing you, as always, good trading.
For more daily market commentary and analysis, visit thegoldforecast.com.
