

Gold and silver both traded lower on Friday on the increased odds for a rate hike later this month. Gold futures fell by $43 or 0.95% and silver futures declined by $0.74 or 1.11% on the day. The catalyst for today’s decline was the US Labor Department’s non-farm payroll report for August showing 162,000 jobs were created in August, massively beating consensus forecasts of just 55,000.
This brought the chance of a September rate increase up to 58.6%, adding about 10% to the chances of higher borrowing costs prior to the report being released. New information lately has only caused fractional shifts in the FedWatch estimates and the current odds now price in a 65% chance of a September hike, up from 55% prior to the report being released. The odds really have not changed much; odds of a hike are only 0.2% higher than they were one month ago.
This had the affect of raising yields on short term US Treasuries taking yields on the 2 year bonds to the same level the highs hit in January 2025. This level at 4.423% represents the record highs over the last 26 months. The US dollar reacted exactly opposite to that of gold with a 0.27% increase in the 15 minutes following the report and just like gold the dollar would spend the rest of the day reversing much of the initial reaction and then consolidating. At the time of writing the US dollar index is up 0.15% on the day at 99.16.
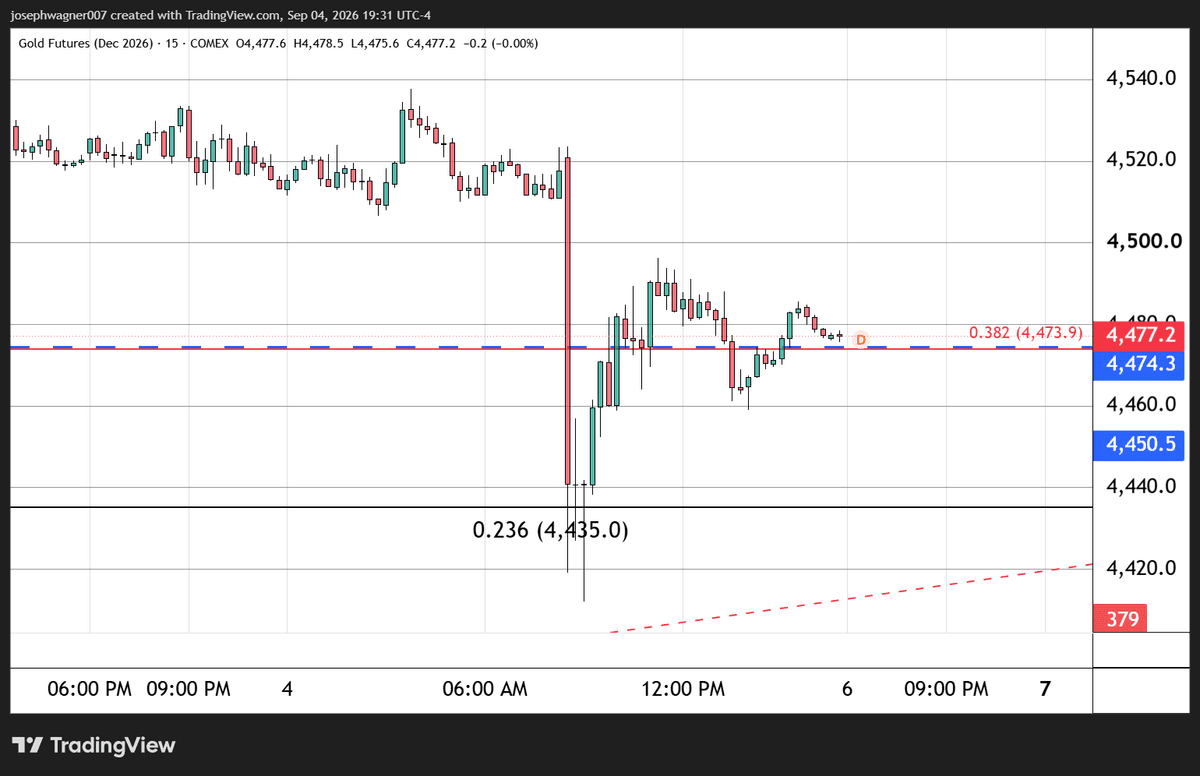
Zooming in on a 15 minute chart of gold futures we immediately see that the payroll report was the only a small bearish fish, in an ocean of bigger bullish sharks. First off the decline today was contained within a 15 minute period and the rest of the day consisted of recoveries and short consolidation periods. Most important is that gold moved and held back above support at $4,474 which we have been labeling as critical for gold to continue higher and complete the current wave count that is calling for a triple top in gold over the next month or two.
“Crucially, gold futures have managed to remain above a key support zone formed by a historical area of support and resistance dating back to the end of 2025 at $4,474, which lines up closely with the simple 100-day moving average, now at $4,468. That historical support also aligns perfectly with the 38.2% Fibonacci retracement at $4,474. The retracement data set is of gold’s recent advance from its lows around $4,000 to recent highs made above $4,700. As long as gold can defend this level, it will most likely continue higher”
- Excerpt from The Gold Forecast, August 31, 2026
Gold holding support at this critical level means that gold is still within its bullish third wave and the report did not take it off the path to much higher prices. Silver's near-term outlook is not as certain especially its current wave structure as silver may still be within its second wave meaning its corrective wave could continue to take prices lower still. The technical aspects are just as ambiguous or neutral with the 100-day moving average is still acting as resistance unlike in gold. The Ichimoku paints a picture of a market that is attempting to break above the Kumo or clouds that flip to green in its forward projecting. However, silver is currently inside of its cloud which is currently red, the top of which has been acting as strong resistance for the past few weeks especially the past two days where the upper edge has contained upside moves to a tee.
To learn more, simply head to www.thegoldforecast.com.
Wishing you as always, good trading,
