

My September 16, 2026 read separates Tuesday’s crypto pullback from the market structures that held up, while using volatility, oil and uranium to frame the next decision points.
BTC loses the 0.786 Fibonacci level
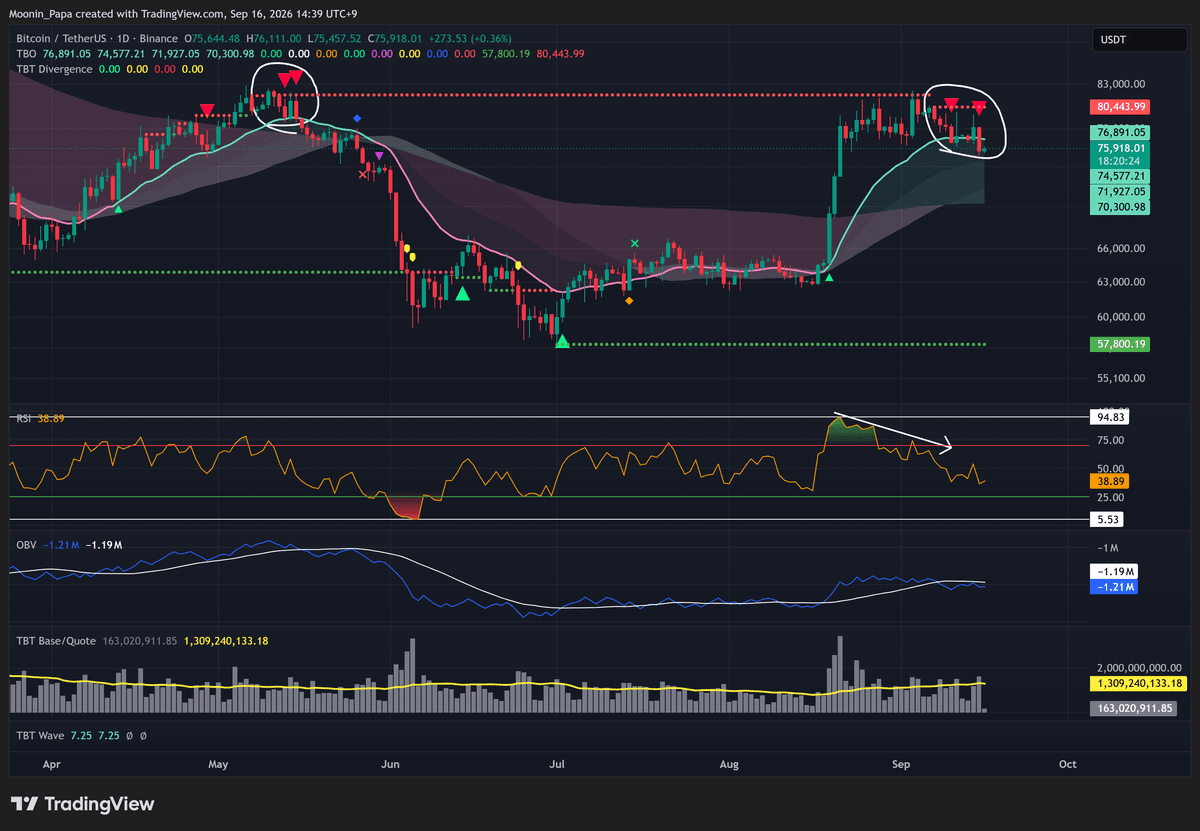
Bitcoin daily Binance chart
BTC fell more than 3% Tuesday, printed a second TBT Bearish Divergence like the one seen in May, and lost the 0.786 Fib. A move toward the 0.618 Fib is likely, but I am not counting BTC out and remain in buy-the-dip mode.
ETH falls inside its Cloud
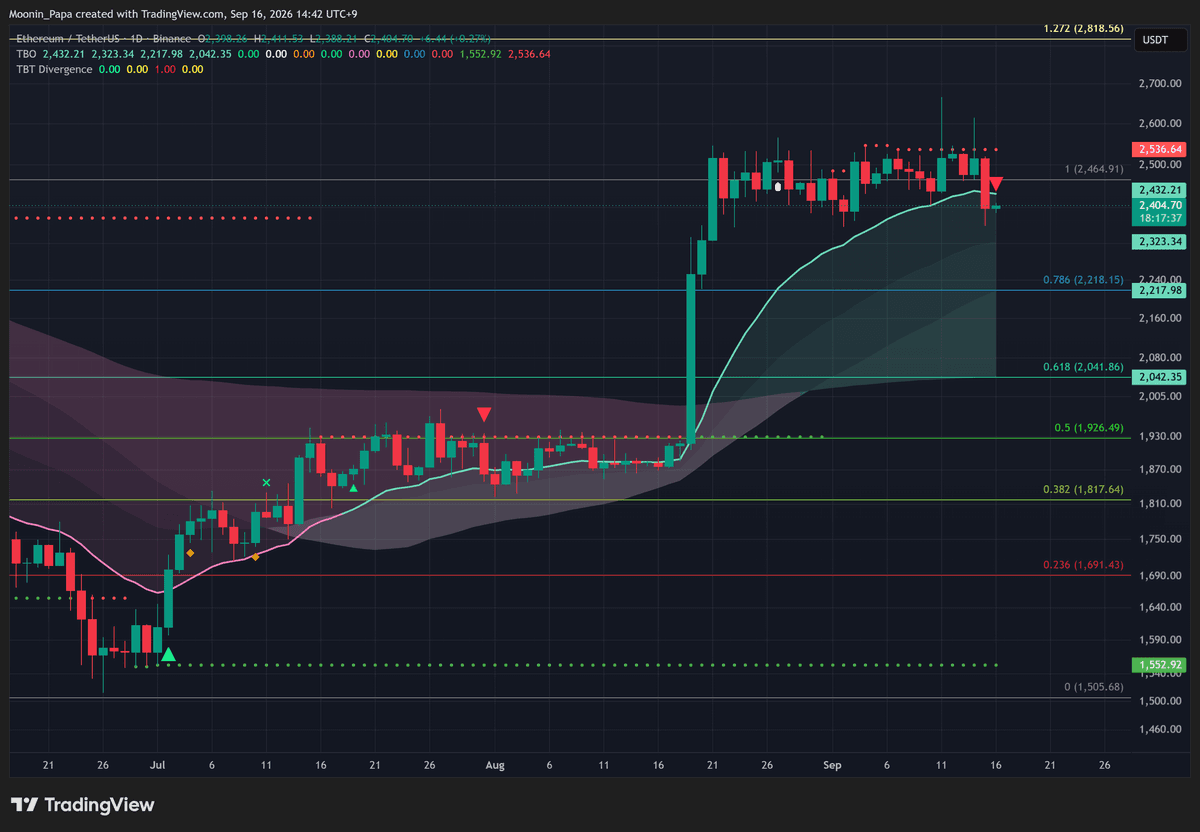
Ethereum daily Binance chart
ETH dropped inside its Cloud and is only now developing a TBT Bearish Divergence. ETH/BTC also printed a bearish divergence, but it wicked into its Cloud without closing there. That distinction matters because the deterioration is real but uneven.
OTHERS dominance holds up
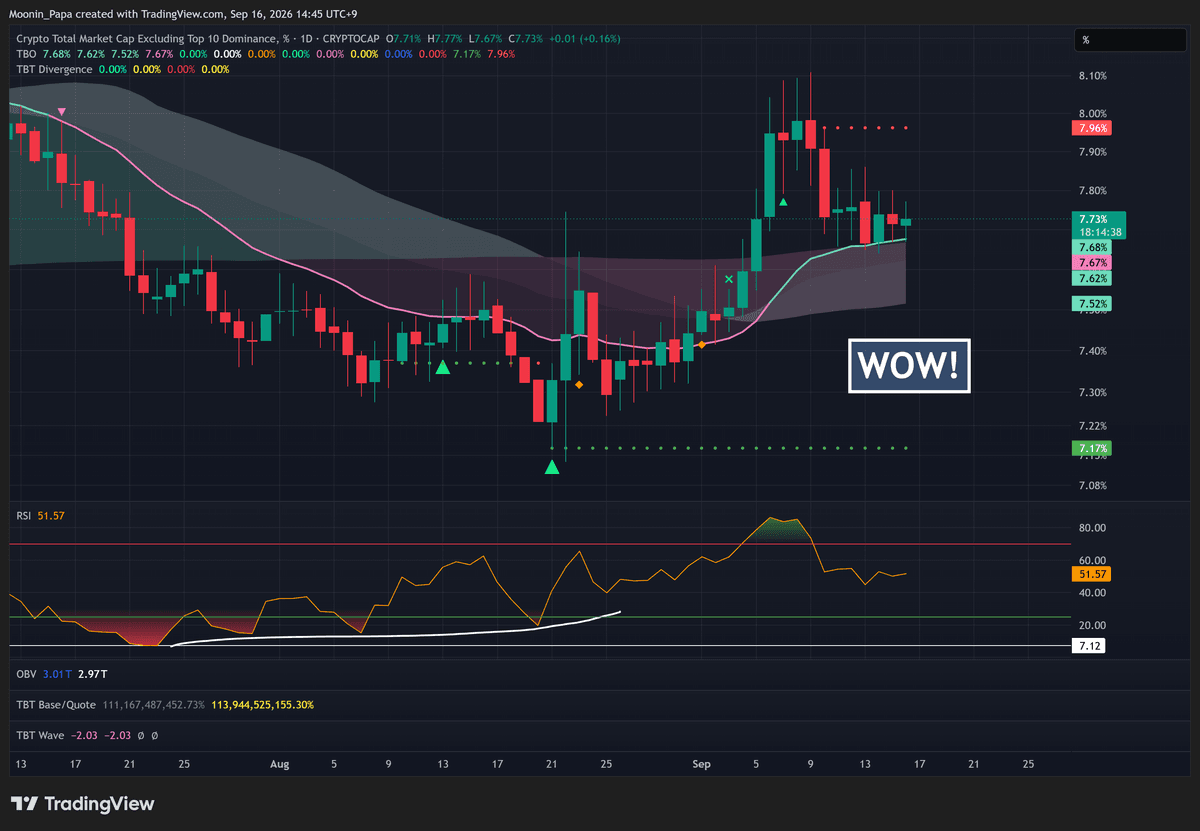
OTHERS dominance daily chart
BTC.D rose during the pullback, creating short-term pain for ALTs, yet OTHERS.D did not close inside its Cloud. The separate OTHERS market-cap chart printed a second bearish divergence and closed inside its Cloud. Dominance is market share, not spot price.

VIX defines the max-fear pivot
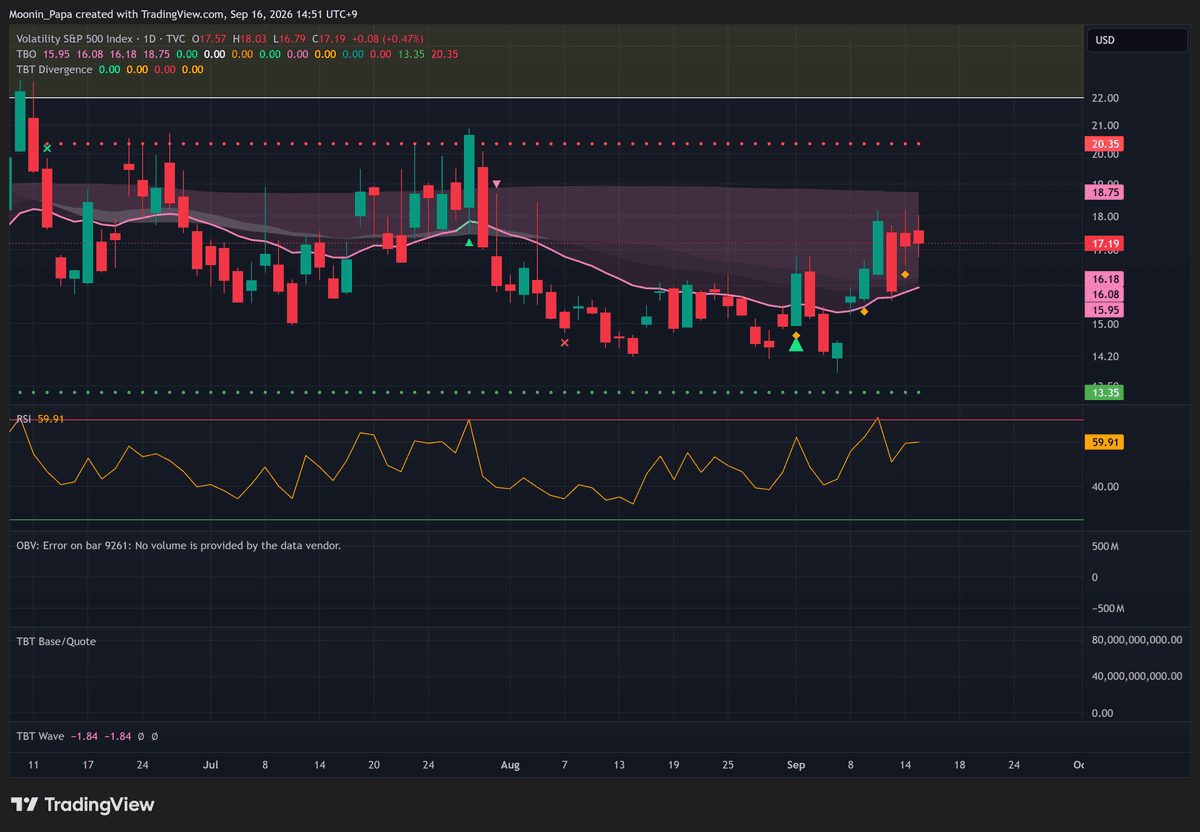
VIX daily TVC chart
I am watching for the VIX to push toward TBO Resistance at 20.35 or the rejection zone beginning at 22. In my framework, that would identify a max-fear pivot for buying the dip, not guarantee the exact turn.
Oil extends an exhaustion-style breakout Cluster
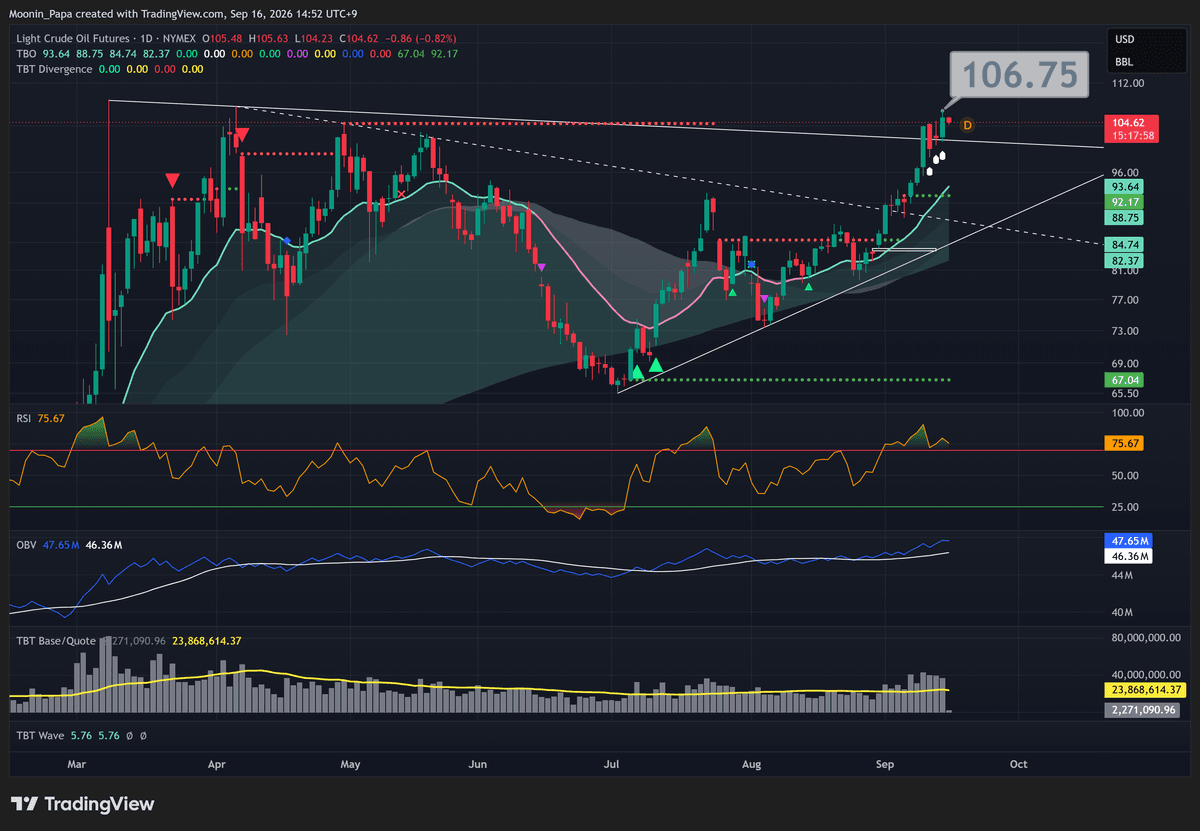
Light crude oil futures daily NYMEX chart
Oil moved higher again, RSI has now been overbought for 10 confirmed bars, and the chart carries a perfect three-in-a-row TBO Breakout Cluster at the top of the move. The trend is strong, but its location keeps exhaustion risk high.
Uranium remains oversold
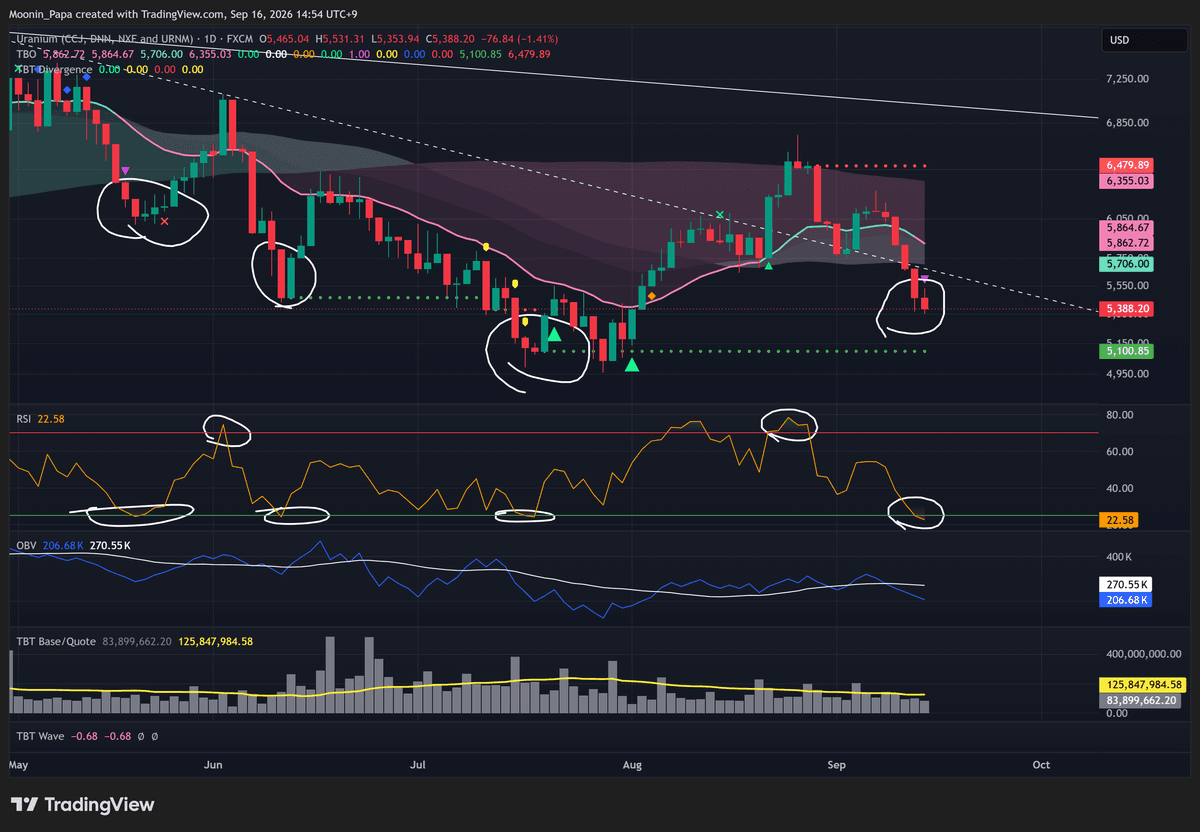
Uranium daily FXCM composite chart
Uranium remains an excellent oversold dip-buy opportunity in my view, with daily RSI at 22.58. This is an opportunity thesis rather than confirmation that a bounce has already begun.
Learn my strategies and the tools I use every day by visiting The Complete Cryptocurrency Investor by Mastering Assets.
