

(Kitco NewsWire) - Spot gold and silver prices are higher in late-afternoon U.S. trading Friday, as a weaker U.S. dollar, fiscal-risk hedging and continued Strait of Hormuz uncertainty kept buyers in precious metals despite another session of elevated Treasury yields. At the time of writing, spot gold was trading near $4,602.99 an ounce, up 1.86%, while spot silver was trading at $68.970, up 1.29% on the session.
North American equity markets closed higher, trimming losses from a volatile week. The S&P 500 rose 33.21 points, or 0.4%, to 7,674.37, the Dow Jones Industrial Average gained 517.80 points, or 1.0%, to 53,277.01, the Nasdaq Composite added 113.29 points, or 0.4%, to 26,180.45, and the Russell 2000 rose 25.44 points, or 0.9%, to 3,017.87. European markets also finished higher, with the pan-European STOXX 600 up 0.59% to 654.18, supported by a 2.5% gain in basic resources as the softer dollar lifted gold and mining shares.
The latest positioning remains defined by the gap between stronger near-term activity data and a weaker dollar, lower Fed-hike conviction and fiscal anxiety. The U.S. flash composite PMI rose to 56.0 in August, its strongest reading in more than 4 years, led by a services reading of 56.8, while manufacturing slipped to a five-month low at 53.2. Treasury yields stayed elevated, with the 10-year yield near the 4.7% area and the 30-year yield near the 5.3% area, as investors looked through the Treasury’s long-dated buyback plan and kept pressure on the long end. Fed minutes this week showed several officials were still prepared to raise rates if inflation does not cool, but market pricing continues to lean toward a September hold. Gold has held the breakout because the dollar has fallen below 99.00, fiscal concerns remain front and center and next week’s July PCE inflation report and Fed Chair Kevin Warsh’s Jackson Hole remarks now carry the next major policy signal.
Precious metals remain the standout cross-asset move. Gold traded as high as $4,632.90, cleared the $4,595 technical objective and held above its 200-day moving average region, while silver reached $70.14 before easing back toward $69. Silver has now broken through $66.55, $68.02 and $69.48 during the week, putting the next focus on the $71.00 to $72.08 area. The move has both macro and physical support: the Treasury buyback announcement started the rates-and-dollar reversal, while silver’s industrial-demand and deficit narrative has helped it outperform gold into the close.
The Strait of Hormuz remains the main geopolitical channel into oil, inflation expectations and defensive demand. U.S.-Iran peace talks remain stalled, the U.S. is preparing tougher sanctions against Tehran and commercial traffic through the strait remains well below prewar levels. Oil stayed elevated into the close, with Brent near $93.29 a barrel and WTI near $84.34, leaving the Fed trade conflicted. For gold, the setup remains supportive but not clean: restricted Gulf shipping and a weaker dollar support defensive demand, while high crude keeps inflation risk alive and prevents a clean decline in Treasury yields.
The key outside markets see Nymex WTI crude oil prices lower and trading around $84.34 a barrel, while Brent crude was near $93.29. The yield on the benchmark 10-year U.S. Treasury note is trading near the 4.7% area. The U.S. dollar index is softer. (Kitco Global Index shows how much of today's gold move is the dollar versus the gold market itself.)
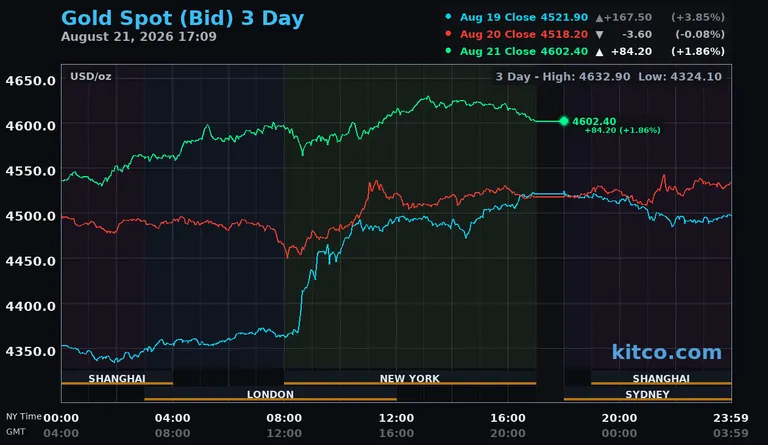
Technically, spot gold bulls' next upside price objective is to push prices back above the $4,653.25 resistance level, with a sustained move targeting $4,852.91. Bears' next near-term downside price objective is a break below $4,453.59, with deeper downside targets at $4,382.83 and then $4,253.93. First resistance is seen at $4,653.25 and then at $4,852.91. First support is seen at $4,453.59 and then at $4,382.83.
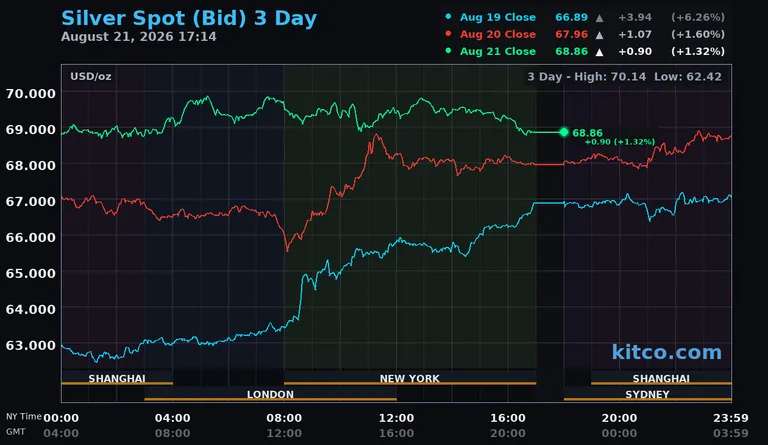
Spot silver bulls' next upside price objective is to drive prices back above $70.14, with a move above that level targeting $71.56 and then $72.08. The next downside price objective for the bears is a break below $66.29, with deeper downside targets at $64.20 and then $62.75. First resistance is seen at $70.14 and then at $71.56. Next support is seen at $66.29 and then at $64.20.
See live precious metals prices for gold, silver, platinum and palladium — in USD, CAD and 12 more currencies.

