

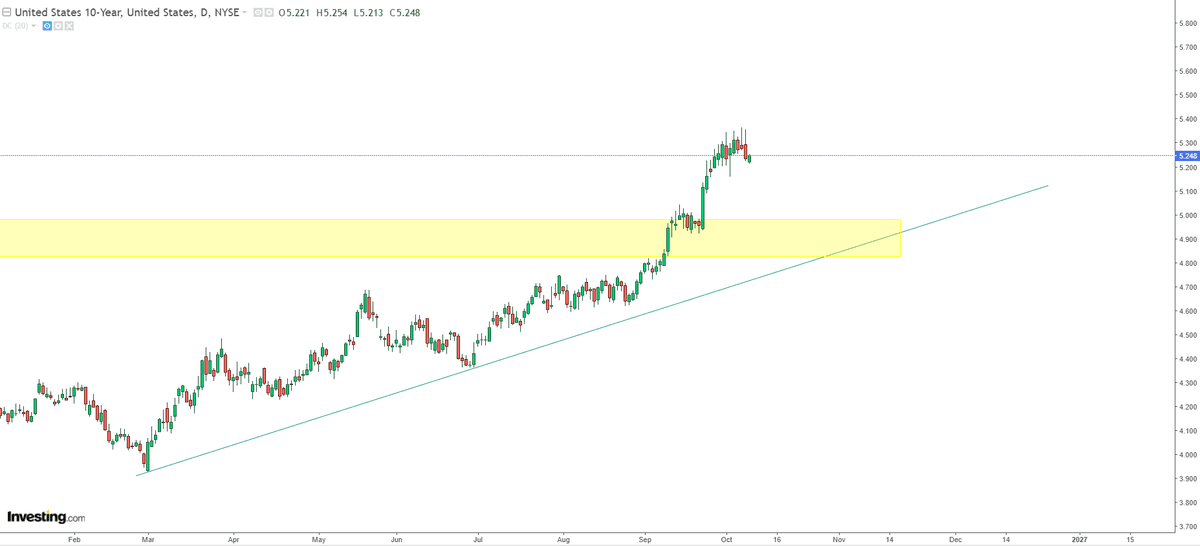
(Kitco Commentary) - The U.S. 10-year yield looks poised to at least slow its run, which may lead to a short-term bounce in gold and potentially all-time highs in the stock market—just in time for the November election. The daily chart below shows a consolidation pattern indicating a potential breakdown, perhaps into the high-4% to low-5% range, in my opinion.
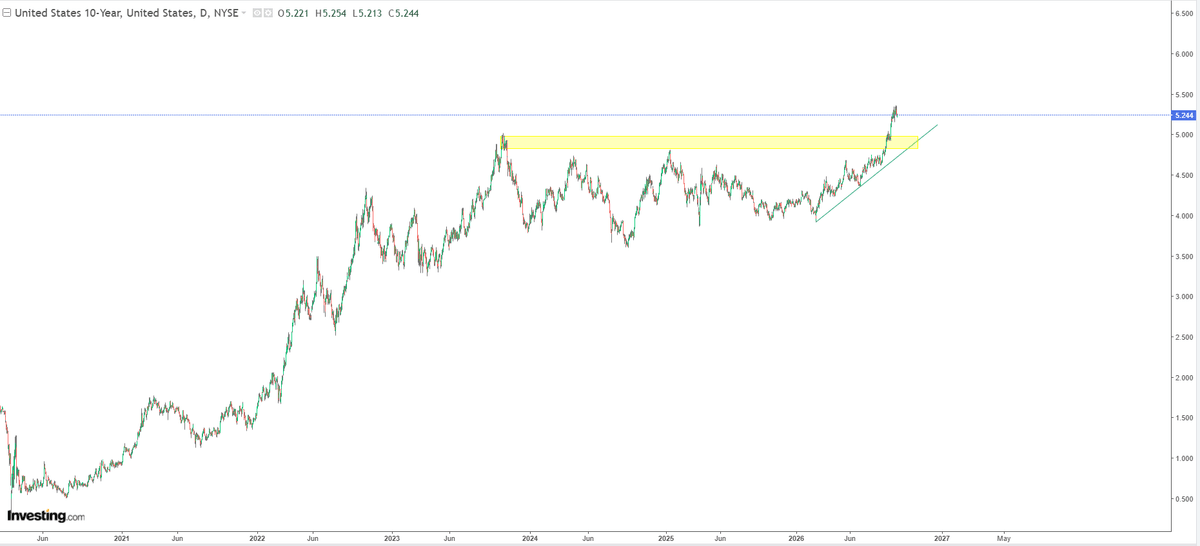
The zoomed-out daily chart shows the extent of the breakout in yields, and we may find that a move down to 5% represents a retest of the long-term breakout before rates move higher still.
For gold, I think a short-term drop in yields could coincide with a bump up to the overhead trendline, presenting a strictly managed trading opportunity for a run just above $4,400. Exit at signs of sputtering momentum.
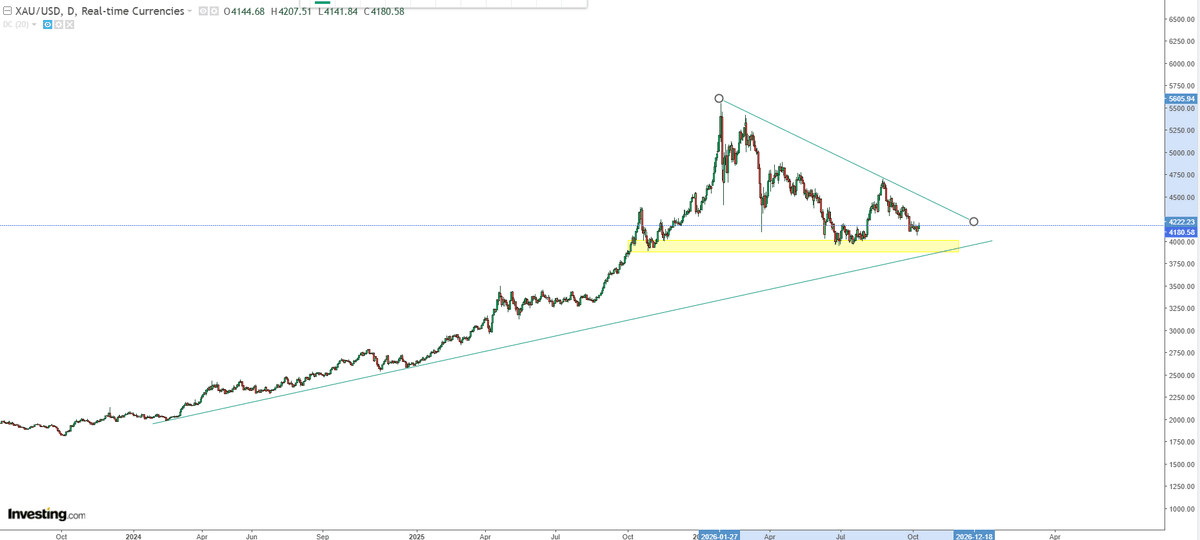
I am watching intently to see what gold might do at the upper trendline if it gets there. A break and hold above it, while yields simultaneously find support and turn higher, may be an indication that something much bigger, which has been brewing for quite some time, is finally ready to be served.
In my opinion, stacking with a long-term view during periods of rate scares remains the overarching protocol.
See live precious metals prices for gold, silver, platinum and palladium — in USD, CAD and 12 more currencies.
