
Strengths
The best-performing precious metal(s) of the year were silver and platinum, up roughly 145% and 135%, respectively. Both metals led 2025’s gains, driven by their roles as monetary safe-haven assets amid expectations of U.S. rate cuts and rising geopolitical tensions. Silver’s record-breaking surge was further supported by deepening supply deficits, China’s threatened export restrictions, and strong industrial demand from EV and solar manufacturing.
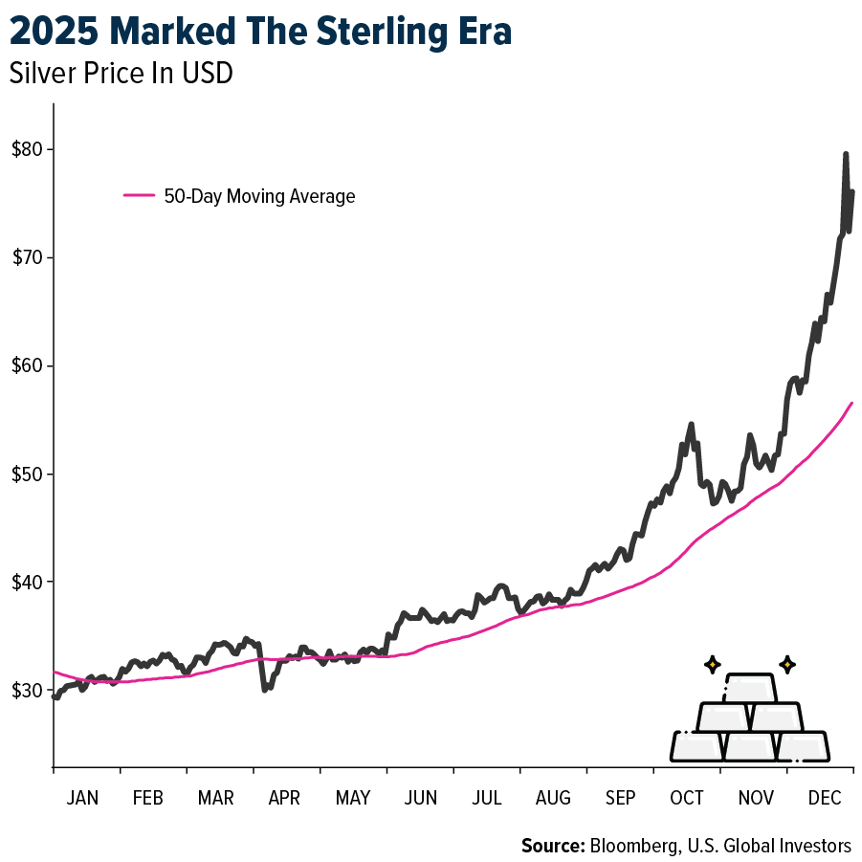
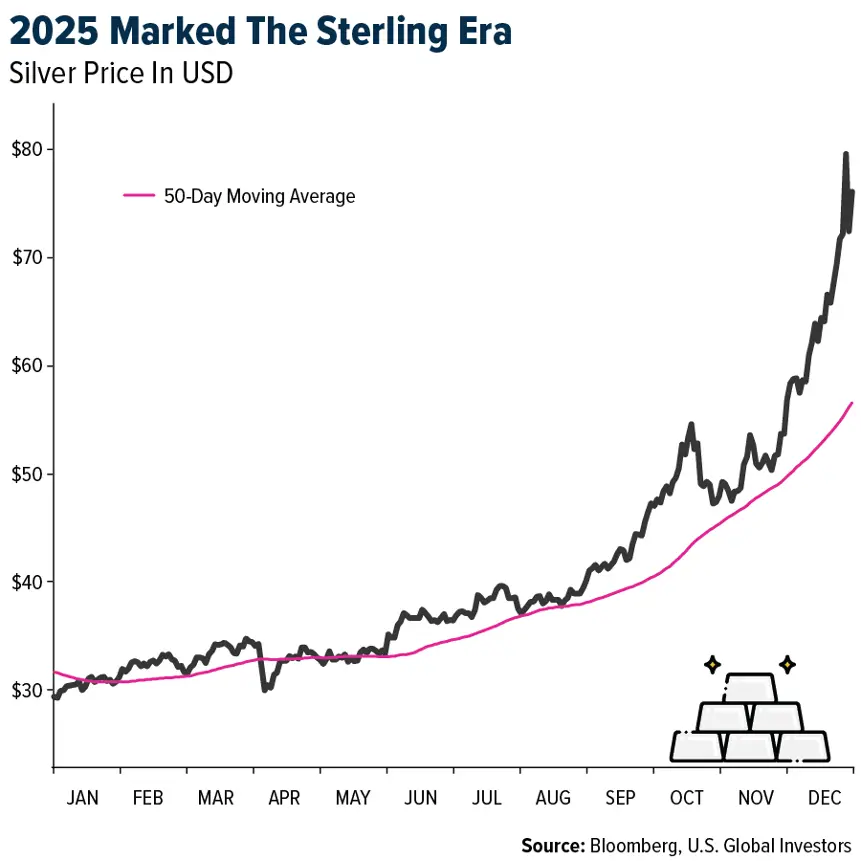
- Silver climbed above $80 an ounce, a new all-time high, while gold hovered near fresh record levels, supported by exiting crypto investors who saw a FOMO case for precious metals ownership. The move capped a standout, record-breaking year for silver, with spot prices extending one of their strongest annual rallies in decades.
- Platinum surged to record highs, driven by major supply disruptions from Russia and rising demand for precious metals. Heavy trading activity on a newly launched Chinese futures contract added to the momentum, particularly as conditions tightened in London, shipments to China increased, and confidence in Chinese demand grew following the start of trading on the Guangzhou Futures Exchange.
Weaknesses
- The worst-performing precious metal(s) for the year were gold and palladium, up 58% and 70% respectively. Both lagged the explosive gains of silver and platinum in 2025 but remained fundamentally strong as monetary and strategic store-of-value assets. Gold’s performance was supported by massive central-bank accumulation of over 1,000 tonnes, driving prices to record highs despite limited new exploration and persistent macro uncertainty. Palladium, though pressured by long-term EV demand concerns, advanced as supply constraints and tight global inventories supported prices.
- Since 2014, 31 African countries have updated their mining codes to boost government and community involvement in resource extraction, according to Mining Weekly. Resource nationalism remains particularly strong in the Sahel region, namely Mali, Burkina Faso, and Niger, and is spreading across the continent. These nations are taking advantage of rising commodity prices by raising taxes and royalties, requiring state ownership, and sometimes pursuing outright nationalization to maximize the value of natural resources.
- Even as gold and silver prices neared record levels in 2025, all-in sustaining costs for many producers remained high, averaging $1,540–$1,680 per ounce in Q3 and rising notably year over year. Higher labor and energy costs, increased maintenance and ore processing expenses, and elevated sustaining capex for aging assets lifted cash costs per ounce by 20–40% in some cases. This cost pressure limited margin expansion despite strong metal prices, forcing producers to focus on efficiency programs and tighter cost control to protect free cash flow.
Opportunities
- The gold price is up 80% since September 2022, and while impressive, it still lags the previous three gold bull markets over the past 25 years. Looking further back, the current move is roughly in the middle of past gold cycles. UBS remains bullish on gold, driven by expectations for US rate cuts being pushed out and supported by continued: 1) official sector buying, 2) haven demand, 3) low positioning, and 4) ongoing liquidity issues. Gold mining company results to date have highlighted beats on returns, which are expected to continue ramping up through increased cash generation, before investment options are exhausted and the inevitable M&A cycle begins.
- Gold and other precious metals delivered exceptional performance in 2025, with spot gold rising roughly 70% year-to-date and topping $4,500 an ounce at year-end, while silver surged around 150–160% and set new record highs. Gains were fueled by safe-haven demand, inflation hedging, and expectations of U.S. rate cuts and easing monetary policy from the Fed and other central banks. In contrast, Bitcoin underperformed, finishing the year down about 5% and trading well below its October peak near $125,000, showing that crypto did not keep pace with precious metals despite similar macro drivers. This divergence underscores a renewed investor preference for physical precious metals as reliable stores of value amid quantitative easing and central bank liquidity programs, reinforcing gold’s strategic role in portfolios alongside traditional hedges.
- Bank of America calculates that the world’s central banks would need to purchase just over 11,000 tons of gold to reach 30% of total reserves. This is equivalent to roughly 10 years of buying at recent elevated annual levels. Excluding central banks that already hold at least 30% of reserves in gold, the remaining central banks would need to purchase 24,665 tons to reach 30%, equivalent to more than two decades of purchases at current elevated levels.
Threats
- New gold deposit discoveries have declined sharply over the past decades, averaging 18 per year in the 1990s, 12 in the 2000s, and just 4 in the 2010s. Between 2020 and 2023, there were only 5 major discoveries despite higher exploration spending. Scotia expects 2024 reserves to remain largely flat net of depletion, with higher gold price assumptions for reserves ($1,300–$1,400/oz) and resources ($1,600–$1,800/oz).
- The late-2025 silver flash crash, when prices fell from above $80 to the low $70s following CME margin hikes, underscores near-term volatility driven by leverage and positioning. Such dislocations are often financial rather than fundamental, historically creating attractive entry points. Structural demand from solar, electrification, and advanced electronics continues to tighten the physical silver balance, supporting long-term risk-reward for patient investors.
- RBC notes that gold equities sharply outperforming gold when prices are flat is rare, and historical periods of outperformance are often followed by underperformance, warranting caution. They also highlight that large-cap gold equities traded at unprecedented free cash flow yields above 8%.