You might think you’re late to the party.
Gold is trading above 5,000 and silver is holding near 80, at least for now. Miners and juniors were ripping until just last week.
Yet this bull market is still in its early innings.
The following charts lay out the evidence.
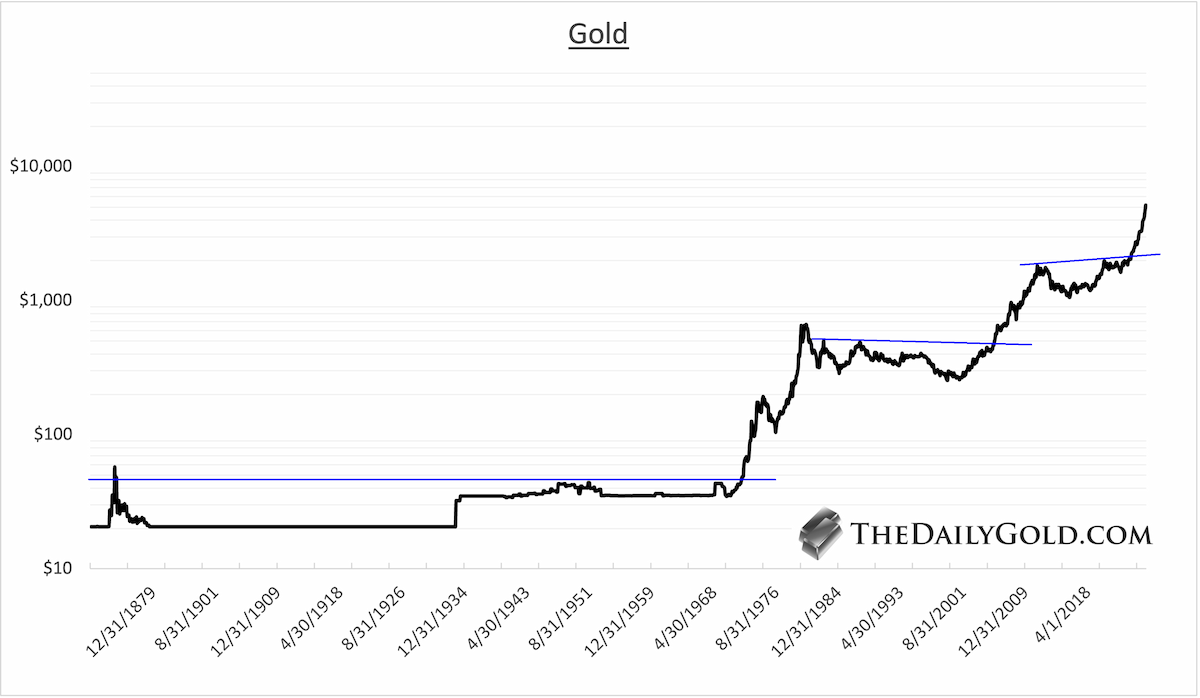
First, consider Gold’s 2024 cup and handle breakout from a 13-year-long base in the context of history.
This is one of Gold’s three major breakouts.
First was the Greatest Breakout of All Time in 1972.
Then came a breakout from a multi‑decade base in 2005 (not to new all‑time highs), and now the current breakout.
The 1972 move ran for 8 years into a secular peak.
The 2005 breakout ran for over 6 years before topping.
Today’s breakout is not even 2 years old yet.
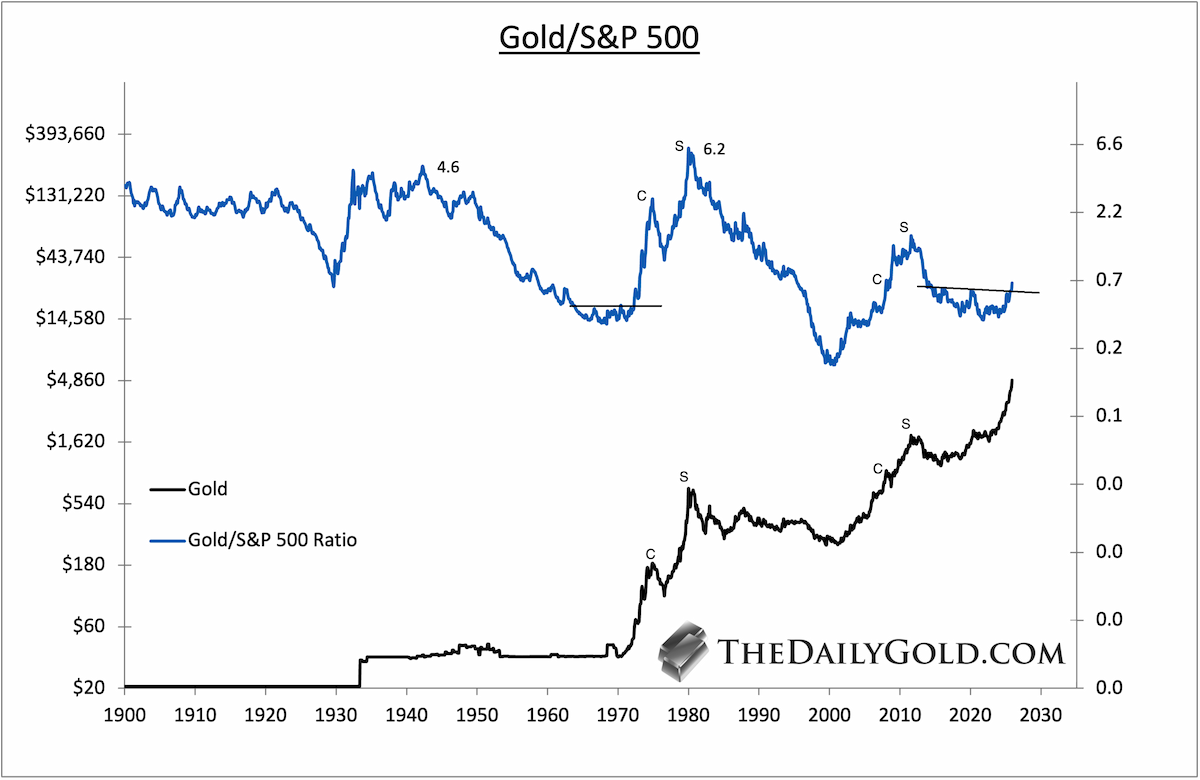
Gold’s performance against the stock market can help us spot cyclical and secular peaks.
Gold just broke-out from a 12-year-long base against the Stock Market.
Accelerated moves to the upside in this ratio lead to both cyclical (C) and secular peaks (S) in Gold and precious metals.
The move in Gold against the Stock Market is only starting.
Next, take a look at Gold’s performance against the 60/40 Portfolio, which is 60% Stocks and 40% Bonds.
The 60/40 benchmark is a powerful lens because it captures Bonds, the largest asset class.
Historically, once Gold broke out against the 60/40 Portfolio, secular bull markets persisted for roughly 8 years and 9 more years.
Today, we’re barely more than 12 months into the current breakout move.
Furthermore, so far this cycle, Gold is up 121% versus the 60/40 Portfolio, while the 1974 cyclical peak came after a 448% gain versus 60/40.

This chart shows the Gold price necessary to back the Monetary Base.
This is based on the fluctuations in the Gold price and US Gold reserves.
The secular peaks during the Great Depression and 1980 occurred at well over 100% backing.
The present backing is 21%.
The cyclical peak at the start of 1975 came at 62% backing.

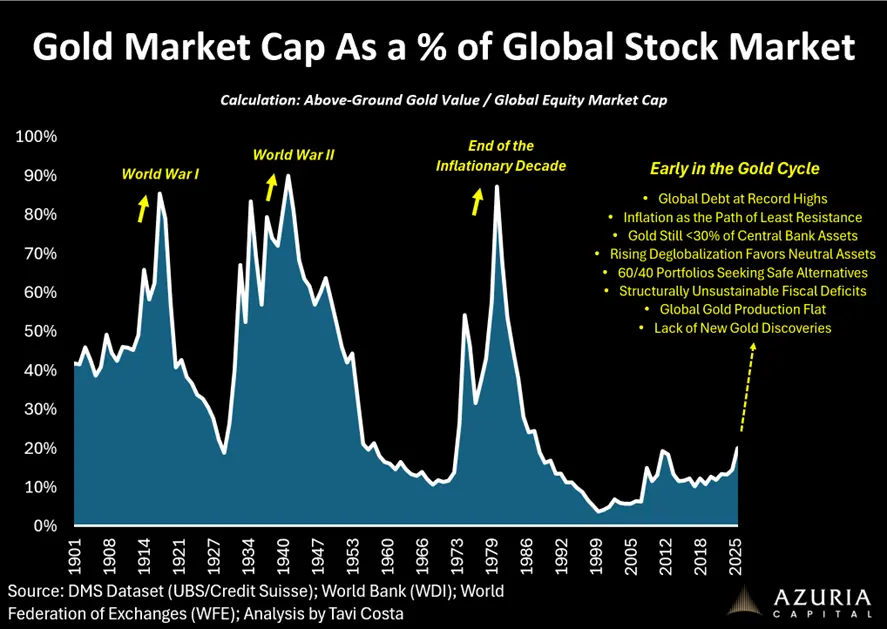
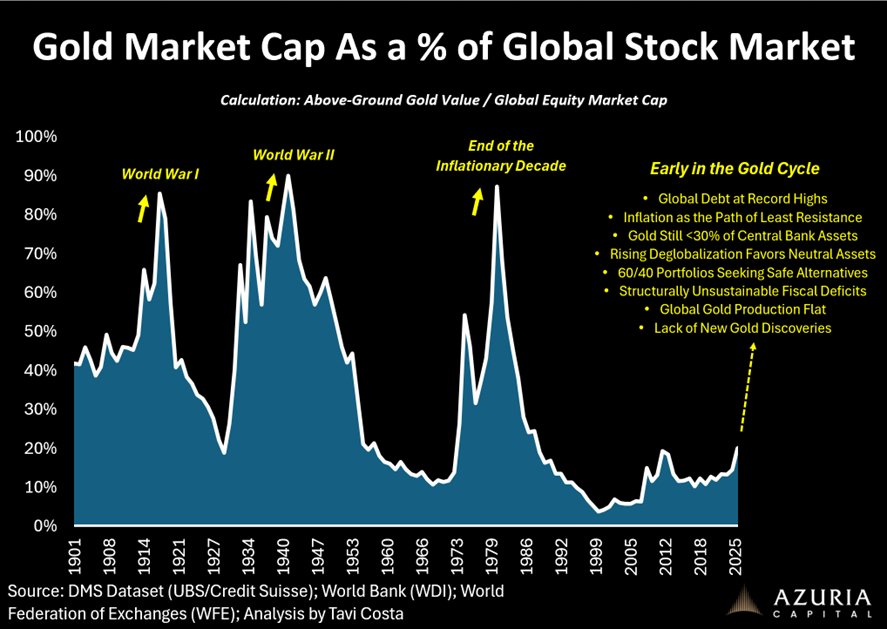
It is a similar picture when we plot the total value of above-ground Gold against the market cap of the Global Stock Market.
The peaks in 1980 and Great Depression were around 90%.
The cyclical peak in early 1975 was 55%.
Currently, it's 20%.
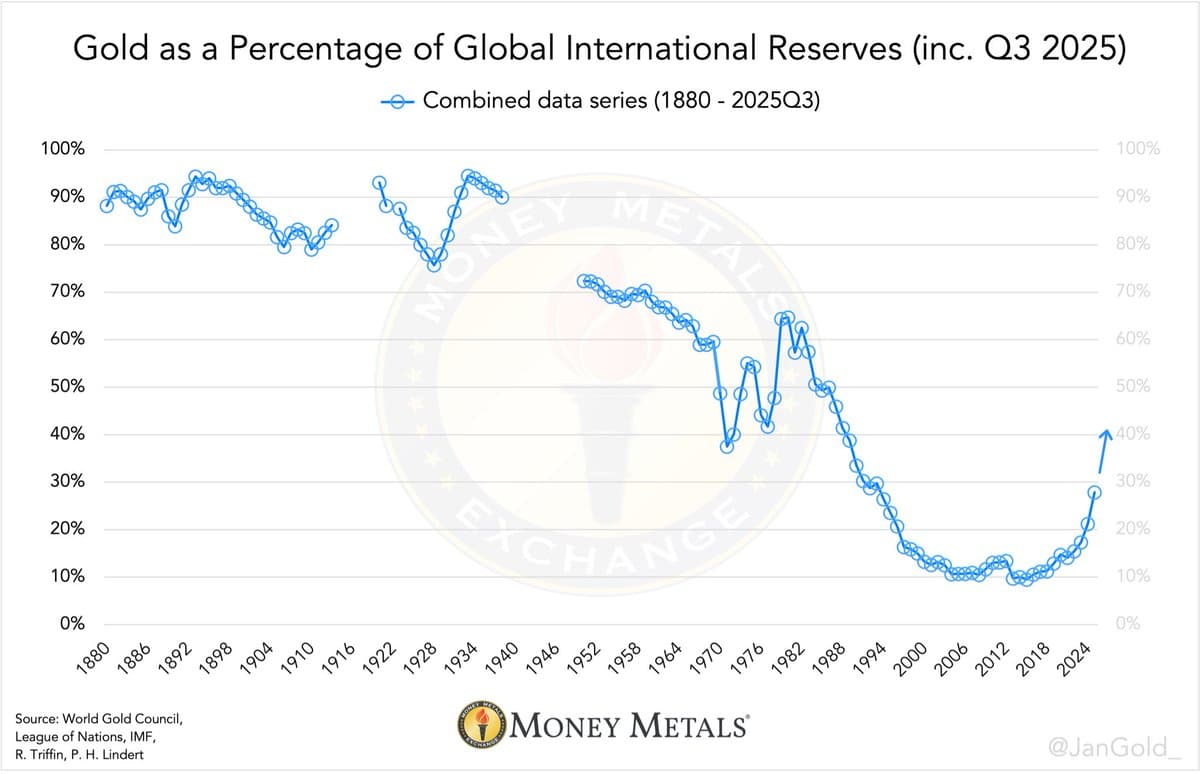
Central Banks have been buying Gold aggressively in recent years.
But Gold as a percentage of International Reserves is well below its level in the 1970s.
This excellent chart is from @JanGold_
From 1971-1980, Gold as a percentage of International Reserves increased from ~38% to ~65%.
Gold's share is increasing materially. But at 27%, it remains well below the levels of the 1970s.
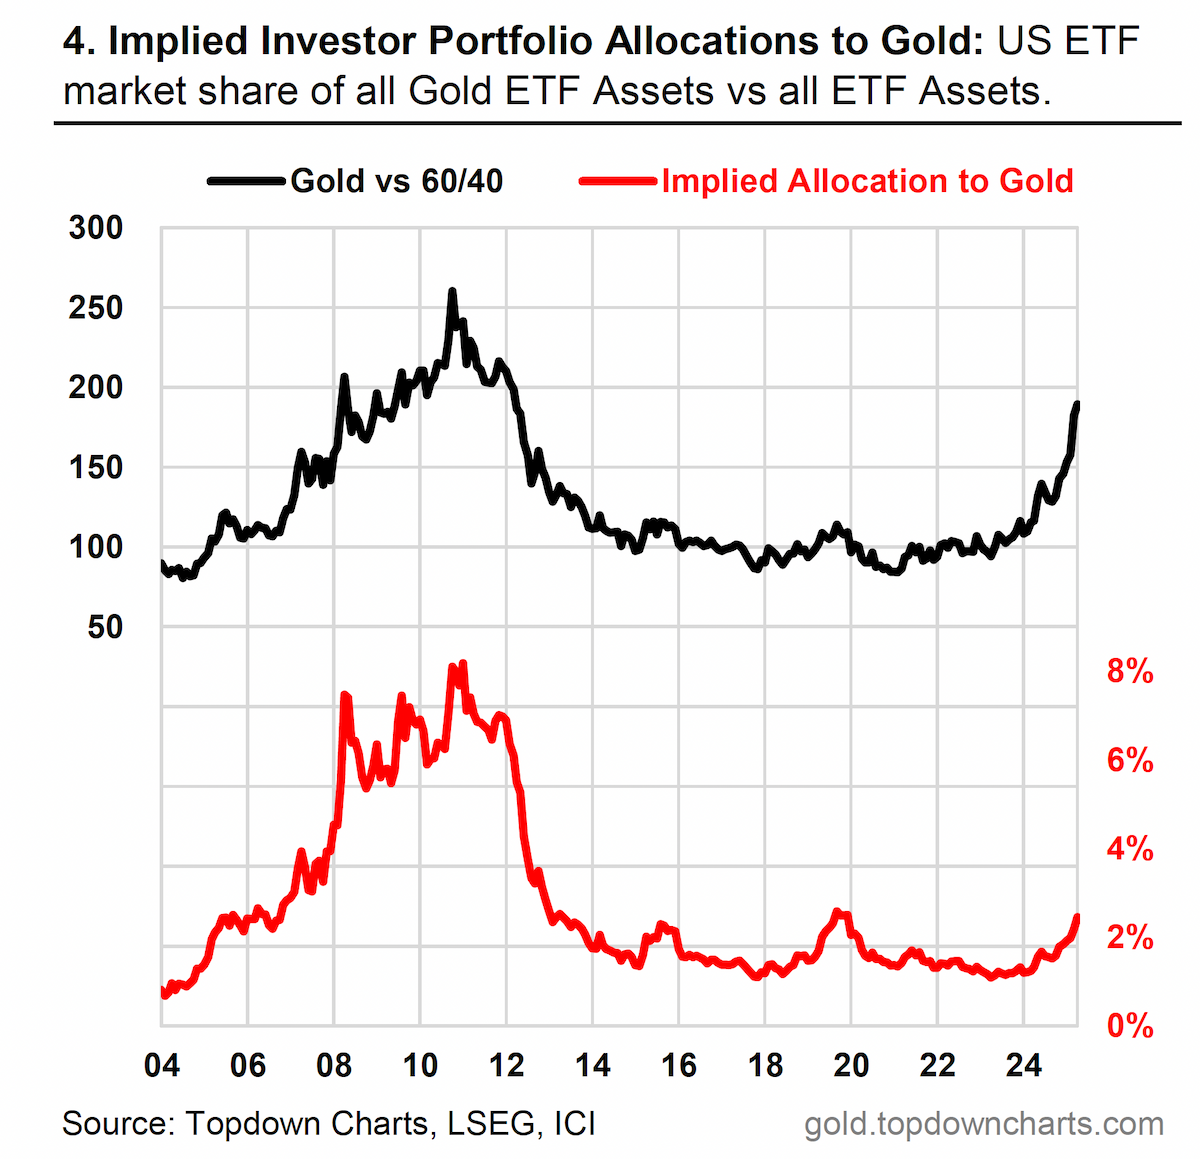
Finally, Gold remains underowned.
Gold ETFs as a percentage of all ETF assets is barely above 2% right now.
Call it 2.5%. It peaked above 8% in 2011. From @Callum_Thomas
Gold confirmed a breakout from a 13-year cup & handle pattern in March 2024 — marking the start of a new secular bull market.
This trend has years left to run, as confirmed by the charts in this thread.
Capital began rotating out of Bonds and into Gold in 2022–2023.
With Gold also breaking out from a 12-year base vs. the Stock Market, that rotation is now accelerating — away from Stocks (especially Tech, as detailed in previous research) and toward Gold & Precious Metals.
Gold’s cyclical bull market is likely only halfway done — and still has plenty of upside, given key metrics remain far below their 1974 peak levels.
The current correction could provide excellent entry points that won’t be seen again.
To learn the gold and silver stocks we own and cover with 5x upside potential, consider joining our premium service.