
We’re starting the week with a clear shift in tone.
The dollar just pushed back above the psychological 100 level, while gold and silver are… hesitating. Not reversing, not continuing… just waiting. And when markets pause like this it usually means one thing: a bigger decision is coming.
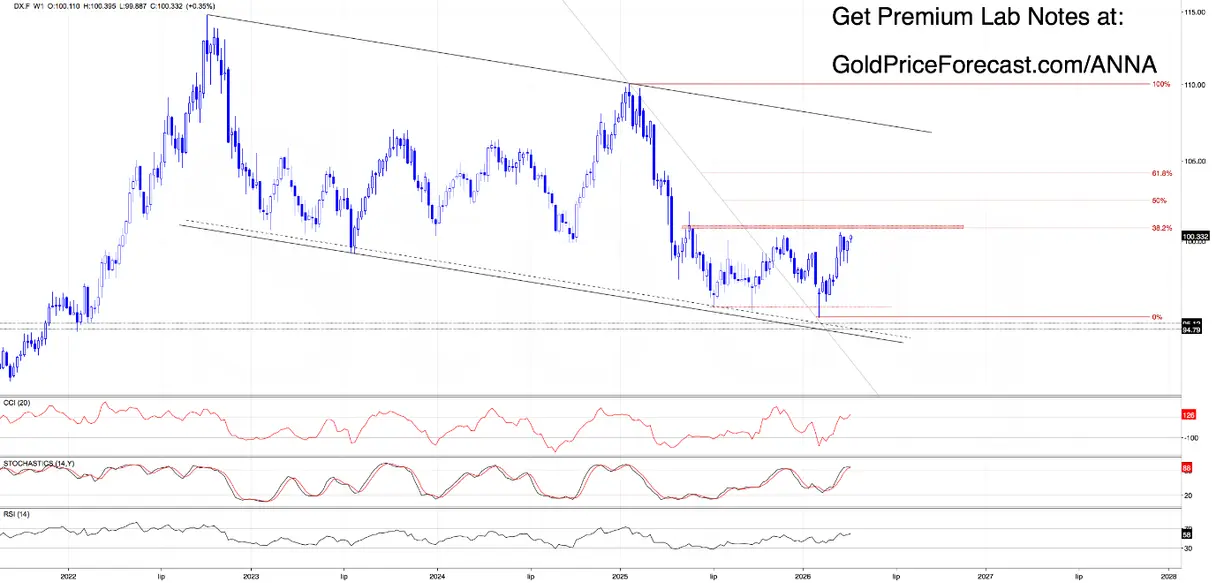
USD (DX.F): Back Above 100, But One Barrier Still Matters

The first thing that stands out is today’s bullish gap (99.98-100.11), which pushed the dollar back above the 100 level and now acts as immediate support.
Bullish? Yes - technically, this is a strong signal.
But there’s still unfinished business. The March 16 bearish gap (100.25-100.36) remains open and continues to serve as the first key resistance. Therefore, in our opinion, only a daily close above 100.36 confirms real bullish control.

When we take a closer look at the H4 chart, we see one more technical improvement – the greenback has already broken above the orange consolidation, suggesting continuation (at least as long as this breakout holds).
If bulls confirm the move with a daily close above the mentioned key resistance, the next logical target could be around 101.30, where the size of the upside move would be equal to the height of the consolidation and where the 138.2% Fibonacci extension is.
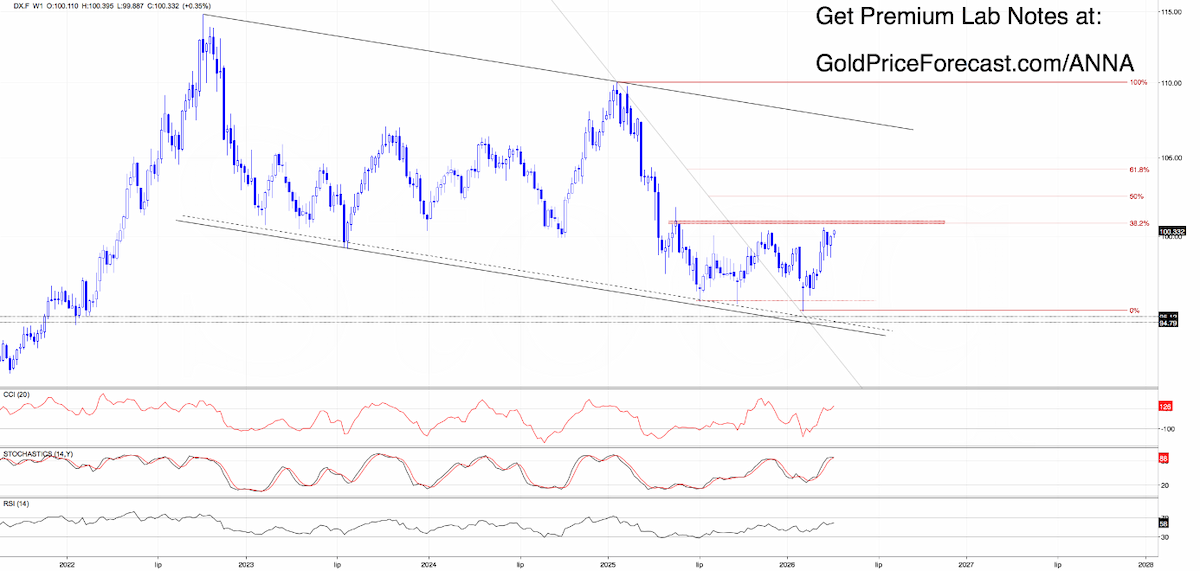
However, when we zoom out our chart even further, we see that on the weekly chart there is one more important resistance zone before 101.30 based on the 38.2% Fibonacci retracement (100.80) and a bearish gap from May 2025 (100.75-100.95).
That’s a serious resistance cluster, which means that even if bulls break higher, this won’t be an easy road.
On the other hand, what could happen if they fail to close the day above the nearest gap? Expect a pullback, which will likely translate into a retest of the breakout above 99.96 (former consolidation top). And that’s where the next decision will happen.
Gold (GC.F) & Silver (SI.F) → these sections are reserved for the full analysis today . And the timing is not random: we’re sitting at technical zones that can shape not only tomorrow’s session, but the entire week ahead.
Key Levels to Watch
Dollar
Resistance: 100.25-100.36 (red gap from March 16) / 100.80 (the 38.2% Fibonacci retracement) / 100.75-100.95 a bearish gap from May 2025 / 101.30 (potential next upside target)
Support: 99.98-100.11 (today’s bullish gap) / barrier of 100 / 99.40-99.46 (bullish gap from March 26)
Gold
Supports: (…)
Resistances: (…)
Silver
Supports: (…)
Resistances: (…)
Today’s Takeaway
Dollar: bullish bias but needs confirmation. Above 100 looks strong -> but 100.36 is the real trigger. Therefore, break & close above it suggests continuation toward 101+. However, failure -> pullback to at least 99.96.
Gold: (…)
Silver: (…)
Execution Plan: focus only on key levels that trigger moves and let price confirm before entering. If you don’t want to miss the next move while it’s being built - not after it’s already happened - you can test Premium Lab Notes for 7 days for free here:
👉 Premium Access: Anna’s Trading Lab
Stay patient, respect the levels, and let the market show its hand before committing fresh risk.