Kitco Global Index (KGX): Uncover the Real Value Behind Commodity & Crypto Prices
Separating Market Values from USD Influence
Now Featuring Top Cryptos - Track Bitcoin, Ethereum, and more alongside precious and base metals, separating market values from US Dollar influence.
Commodities | Last (Bid) | Change due to USD performance | Change due to normal trading | Total change | |
|---|---|---|---|---|---|
Commodities | Last (Bid) | Change due to USD performance | Change due to normal trading | Total change | |
|---|---|---|---|---|---|
Commodities | Last (Bid) | Change due to USD performance | Change due to normal trading | Total change | |
|---|---|---|---|---|---|
Commodities | Last (Bid) | Change due to USD performance | Change due to normal trading | Total change | |
|---|---|---|---|---|---|

How US Dollar Strength and Weakness Affect Commodity Prices
The strength of the US Dollar significantly influences commodity prices. When the US Dollar strengthens, it takes fewer dollars to buy commodities priced in USD. Conversely, when the US Dollar weakens, more dollars are needed to purchase those same commodities. This inverse relationship accounts for a substantial portion of price fluctuations.
For example, when the US Dollar strengthens, the price of gold tends to decrease. When the US Dollar weakens, gold prices typically increase. A stronger dollar means each dollar has more purchasing power, making gold less expensive in USD terms. Conversely, a weaker dollar reduces purchasing power, making gold more expensive in USD terms.
Moreover, the effects of the US Dollar fluctuations extend beyond USD-denominated markets. Continuing with the example of gold: if gold prices rise in USD as well as in other major currencies like the Euro, British Pound, and Japanese Yen, it signals a genuine increase in global demand and value. However, if gold prices rise in USD but fall in other currencies, it suggests the price increase is due to a weakening dollar rather than true market demand. This discrepancy can create a misleading perception of increased value, when in fact, a rising supply or other market pressures may be pushing the real value of gold down—masked by the weaker dollar.
Actual supply and demand also affect commodity prices. An increase in supply may lower prices, but if the US dollar is weakening at the same time, it might appear as though commodity prices are rising, even if the real value is declining.
The Kitco Global Index breaks down commodity price movements into two components: the influence of US Dollar strength or weakness, and the effects of regular market trading activity. Interestingly, dollar- related changes tend to affect all USD-denominated commodities in similar proportions.
By understanding these dynamics, investors can better interpret commodity price movements and make better-informed decisions.
Understanding the Kitco Global Index: What It Is and Why It Matters
Understanding the Kitco Global Index: What It Is and Why It Matters
The Kitco Global Index (KGX) is designed to determine whether the value of a commodity reflects actual changes in its value, shifts in the US dollar, or a combination of both. This is particularly important for investors who want to understand the true drivers behind price movements.
Our calculation of US dollar strength or weakness follows the same algorithm used for the USD Index® (USDX). It reflects the value of the dollar relative to a basket of six major foreign currencies: the Euro (57.6%), Japanese Yen (13.6%), British Pound (11.9%), Canadian Dollar (9.1%), Swedish Krona (4.2%), and Swiss Franc (3.6%).
The Kitco Global Index, however, measures the price of a commodity not in terms of US dollars but in terms of the same weighted basket of currencies that comprise the US Dollar Index®. This unique approach removes the US dollar component, providing a clearer picture of a commodity’s value independent of USD fluctuations.
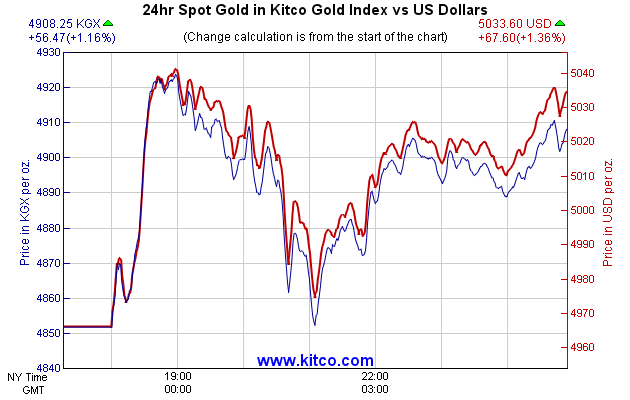
To gain perspective, the KGX must be compared to the actual US dollar price of that commodity. Our historical and live charts display both trend lines, allowing for direct comparison. Here’s what different scenarios might indicate:
Scenario 1: KGX is up, and the USD price of the commodity is up even more
This scenario indicates that the commodity has increased in value. Additionally, it means the USD has weakened, exaggerating the increase in the commodity’s value when viewed in USD terms. This was a common occurrence in the early 21st century.
Scenario 2: KGX is down, and the USD price of the commodity is down even more
This scenario suggests that the commodity has decreased in value, though not as drastically as it might appear in USD terms.
Scenario 3: KGX is up, and the USD price of the commodity is down
In this case, the USD has strengthened relative to other major currencies, but the commodity has gained value overall.
Scenario 4: KGX is down, and the USD price of the commodity is up
This indicates that the USD has weakened relative to other major currencies, and the apparent rise in the commodity’s price reflects the weaker USD rather than an actual increase in the commodity’s value.
By understanding the Kitco Global Index, investors can better interpret the underlying factors affecting commodity prices, leading to more informed investment decisions.