Going into the biggest and most important economic report today, the US NFP data, which came much higher than expectations, The gold price was well on track to finish the week in negative territory and experienced a further sharp sell-off in the aftermath of the report. After the US Jobs report, the situation has only become worse (in the short term) for the gold price, as it is more likely now that the price will post losses for today. All of this has taken place as investors have remained very risk-averse throughout this week, which should have supported the gold price, but it didn’t. To put things in perspective, the US equity market is well on track to record the worst start to the year since 2008 as investors are trying to make sense of the next potential move by the Fed, and today’s economic report has huge relevance to both the equity players and gold traders.
Background
Today and this week, investors have spent most of their time on the edge, as the US jobs market was the most important economic event of this week. Investors have been very much priced in a goldilocks scenario, which means that they have been expecting the US jobs market to print a number, which doesn’t show that the US jobs market is really strong, as that would make the Fed think that they can possibly increase the interest rate or keep the rates higher for longer. The second thing or thesis that they had before the data or gold traders wanted to see in the economic number wasn’t too much of a softness as well, and this is because if the number had been too soft, it would have spurred fear and anxiety among investors about the possibility of the economy slowing down more than expected, fueling the fire for a hard landing, which would have made traders more cautious. Although a weak economic number usually triggers cautious behaviour among traders, it doesn’t always spur a rally in the gold price.
The Data
The US NFP data printed a reading of 216K, while the expectations were for 170K, and the previous number was 199K. The US unemployment rate fell further to 3.7%, while the consensus was for 3.8%.
What to make of the data
The data was stronger than expected, and the gold price has fallen on the back of the number as the dollar index strengthened. This is because traders are thinking that the rate cut may not take place that soon as the Fed has extra confidence in keeping the interest rate higher for longer. Remember, the higher interest rate impacted the housing sector and the construction workers, but today’s number has shown that construction workers have found more jobs and the activity has ticked higher, which means that there may not be that much weakness in the market.
However, it is important to keep in mind that the market’s reaction in the first few hours usually fades as the dust begins to settle. The reality is that the Fed cannot afford to keep rates higher for longer, and I continue to think that a rate cut in the second quarter of this year is still on the cards.
The Price Action
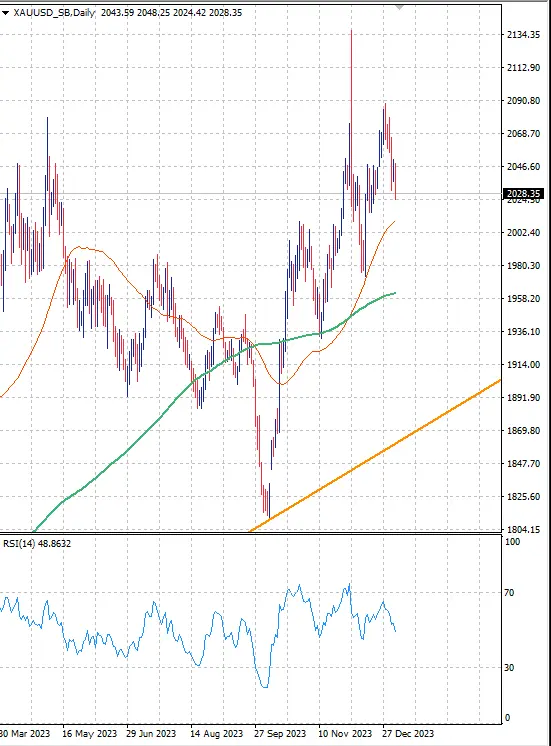
The gold price action has been really interesting if one pays attention to the daily time frame. This is because the price has formed a clear higher highs and higher lows pattern, and the uptrend line has been very much intact when it comes to the gold price. Gold traders have had their eyes attached to this uptrend line, as they have been waiting for a buy opportunity if the price begins flirting with this line. And today’s number has shown that the opportunity that they have been waiting for is finally here.
As for the important price points, there are two important moving averages that I am very focused on: the 50-day SMA shown in red in the chart below and the 200-day SMA shown in green. The 200-day SMA represents the long-term support, which currently sits at 1958, while the immediate to medium-term support is just near the 2010 price mark.
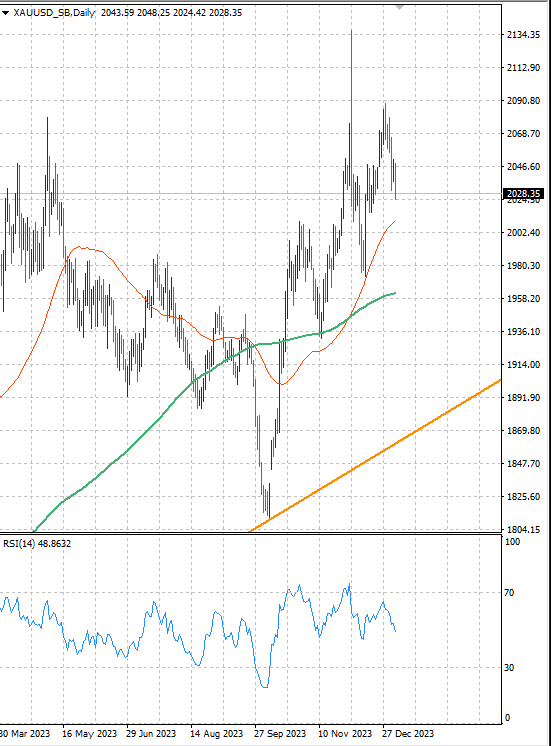
Gold trading price chart by XTB