
Gold futures basis the most active June 2024 Comex contract as of 6 pm EDT is trading up $5.60, or 0.24%, and is fixed at $2,351. That being said, volatility in gold has returned, as seen through today’s expanded trading range. Gold opened at $2,342.60, traded to a low of $2,321.70, and a high of $2,372.50 creating over a $50 range between today’s high and lowest values. Today’s high also served as a new benchmark for gold futures, taking the precious yellow metal to its highest value in history.
While geopolitical tensions and rate cuts by central banks worldwide later this year have been partially responsible for fueling this recent price advance, today’s news was largely fueled by continued central bank purchases, with China leading the way. According to LSEG (LSEG Data and Analytics), China's central bank added 160,000 troy ounces of gold to its reserves in March. Additionally, central banks in Turkey, India, and other European countries have also been adding gold bullion to their reserves.
Traders have for the most part factored in rate cuts by the Federal Reserve and the European Central Bank later this year. According to the CME’s FedWatch tool, the probability of the first rate cut by the Fed in June has contracted a little. Currently, the CME’s probability indicator is predicting a 51.3% likelihood of the first 25 basis point rate cut by the Fed in June. This probability indicator also sees only a 30.6% probability that the Fed will leave rates at their current levels by the July FOMC meeting.
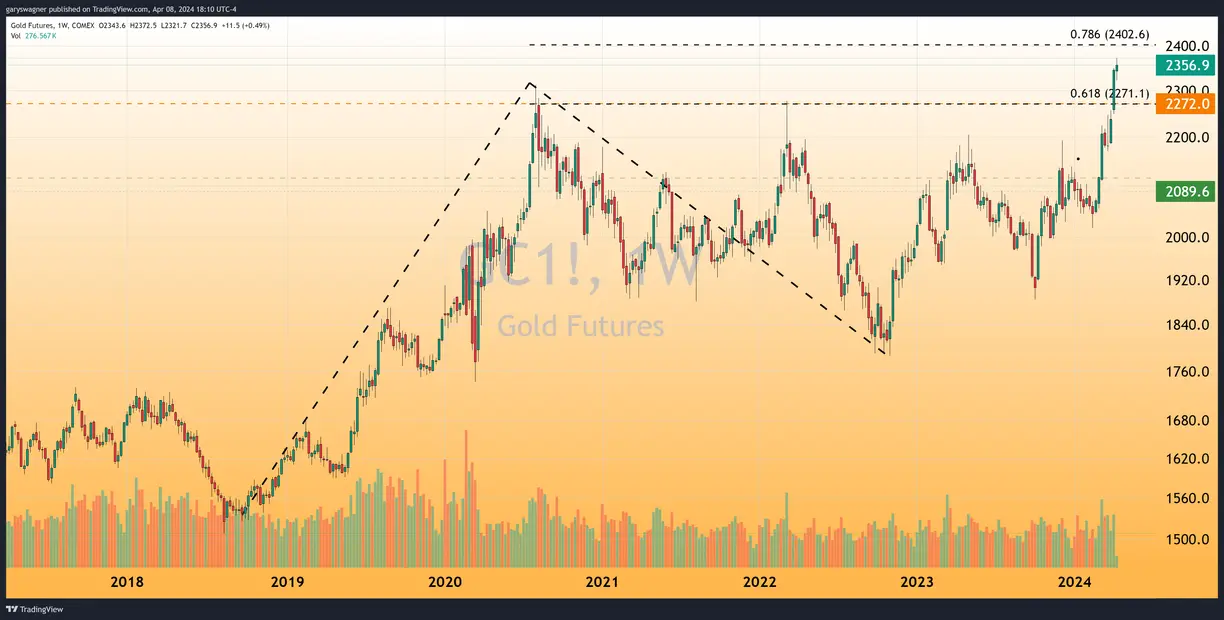
Because gold is trading at its highest historical value, technical analysis is hard-pressed to predict possible resistance points or inflections, as they cannot be ascertained by previous highs or lows in the market. One tool still available to the market technician is a Fibonacci extension. Like a Fibonacci retracement, an extension uses the same important Fibonacci numbers such as 61.8%, or 78.6% but as the name suggests, extensions measure the price movement of the last move and plot possible resistance areas above the current price.
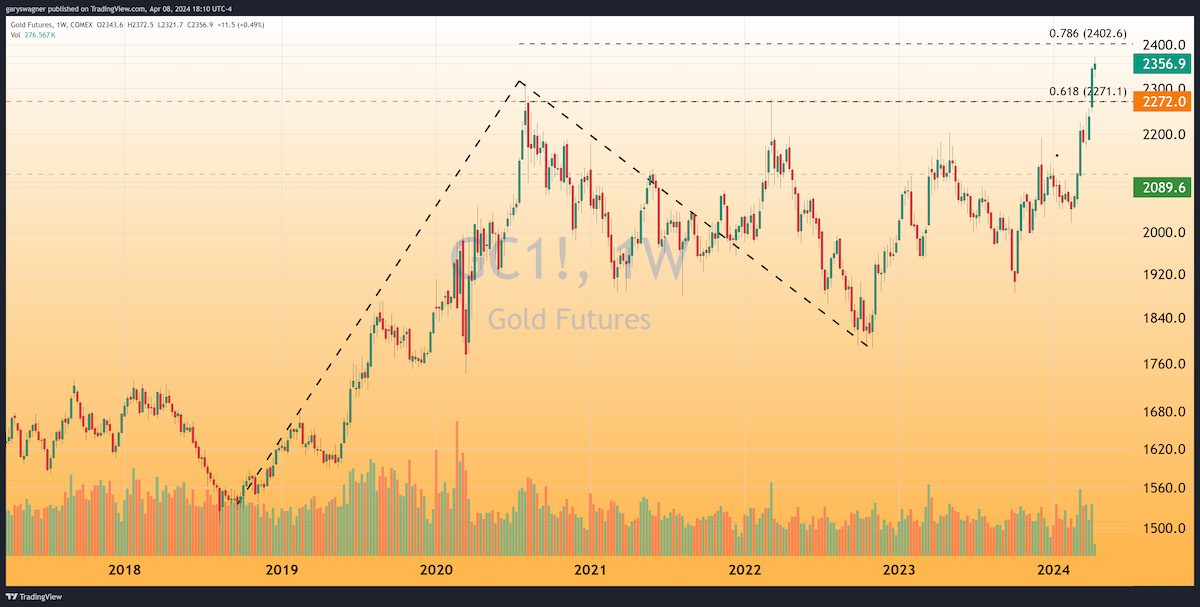
The chart above is a weekly chart of gold futures showing our current long-term Fibonacci extension. Gold futures broke through the 61.8% Fibonacci extension when utilizing the move from mid-2018, when gold began to rally from $1,530 in July 2020 to $2,309. The extension begins from the lows that occurred in October 2022 at approximately $1,800. The next potential area of resistance if gold continues to rise is the 78.6% Fibonacci extension that occurs at $2,402.
Of course, we could see gold prices pull back after such a strong rally with any bearish fundamental report, such as the Fed reducing the amount of rate cuts this year. However, all things being equal, gold could continue to higher pricing or consolidate and trade sideways at any of these new historical highs.
For those who wish to learn more about our service, please go to the links below:
Information, Track Record, Trading system, Testimonials, Free trial
Wishing you as always good trading,
Gary S. Wagner