By John Hathaway
The breakout in gold prices since February has been largely ignored by mainstream investors. Over the past few weeks, gold has moved swiftly from a year-to-date low of $1,993 per ounce on February 13 to $2,230 at the end of Q1 to $2,350 at this writing — a nearly 18% move from its February low. Continued outflows from gold-backed ETFs attest to the disinterest. For the 12 months ending 3/31/2024, holdings of global gold-backed ETFs declined nearly 12%.1 In addition, 75% of investment advisors have less than 1% exposure to gold, the highest percentage of aversion since 2019, as shown in Figure 1.
Gold bullion's breakout is significant in that it represents the positive resolution of a three-year standoff, consolidation, or tug of war between bulls and bears. Many technical analysts, including Carter Worth of Worth Charting, envision price targets 10% higher than the current $2,350 per ounce.
Figure 1. Advisors Hold Little Gold (2017-2024)
Source: BofA Global Research. Data as of 2/26/2024. Included for illustrative purposes only. Past performance is no guarantee of future results.
For the most part, gold’s 14.12% year-to-date price increase (period measuring 1/01-4/09/2024) has generated only a perfunctory media stir. However, the indifference of investors in Western capital markets suggests to us that there is significant potential for further upside. We believe that if buying by mainstream investors approached flows from 2008-2011 (1,645 tonnes added to gold-backed ETFs), the gold price could potentially rise another 25%, well beyond the recent upwardly revised and always behind-the-curve price targets of banking and brokerage analysts. Figure 2 shows the historical flows into gold-backed ETFs for the past 20 years.
Figure 2. Gold ETFs Flows versus the Gold Price (2004-2024)
Source: Bloomberg. Data as of 4/09/2024. Included for illustrative purposes only. Past performance is no guarantee of future results.
The Gold Mining Stocks Opportunity
Gold mining stocks, which have been lackluster, are beginning to respond but they remain historically inexpensive to the gold price as shown in Figures 3A and B.
Figure 3A. Gold Mining Stocks Are Historically Undervalued Relative to Gold (2014-2024)
Ratio of GDX/GLD (VanEck Vectors Gold Miners ETF/ SPDR Gold Shares ETF)2
Source: Bloomberg. Data as of 3/31/2024. Included for illustrative purposes only. Past performance is no guarantee of future results.
Figure 3B. Gold Bullion versus Gold Mining Stocks (2014-2024)
Source: Bloomberg. Data as of 3/31/2024. Included for illustrative purposes only. Past performance is no guarantee of future results.
In our view, gold mining stocks offer upside potential disproportionate to that of bullion. Against the 18% gain of bullion since the February low, mining stocks (GDX) have increased nearly 32% (period of 1/01-4/09/2024). Figure 4 demonstrates the relative performance of mining stocks to metal prices during central bank rate-cutting cycles.
To be sure, persistent inflation might short-circuit consensus expectations for a 2024 rate cut. However, we believe it is only a matter of time before investors discover that the Federal Reserve (Fed) is trapped between a weakening economy and its inflation-fighting mandate. While attention is focused on interest rate cuts, at Fed Chairman Powell's last press conference, he stated that it could be “appropriate to slow the pace of asset runoff fairly soon…if there were a significant weakening of the labor market," a clear tilt toward QE (quantitative easing). To us, it only means that Fed easing is “delayed but not derailed” (thank you, David Rosenberg, for the phrasing).
Figure 4. Gold Stocks Outperform Gold During Rate-Cutting Cycles
Source: Bloomberg as of 3/14/2024. Gold is measured by GOLDS Comdty Spot Price; the PHLX Gold/Silver Sector Index (XAU) is a capitalization-weighted index composed of companies involved in the gold or silver mining industry. You cannot invest directly in an index. Past performance is no guarantee of future results.
In our view, the profit margins of miners are set to expand dramatically, assuming sustained gold prices at or above the first-quarter average of $2,072 per ounce. For the gold mining sector, we estimate a fully loaded cost (extraction, sustaining Capex and exploration, plus corporate overhead, interest and taxes) of $1,750 per ounce. The gold price averaged $1,943 in 2023, indicating an industry-wide profit margin of $200/oz. Assuming a 2024 average price of $2,072 per ounce (same as Q1 2024), the industry-wide margin would rise approximately 61%.
Returns on investment for the industry have been notoriously paltry over the past decade. Our research indicates that most producers' typical return on invested capital (ROIC) is in the mid- to low-single digits (based on Bloomberg data). It is no wonder that investors have lost interest in precious metals miners. In our year-end commentary (Gold Mining Stocks, A Clear and Compelling Investment Case), we postulate that the plaguing cost inflation that had afflicted profitability was abating. Costs stabilizing combined with sustained higher metals prices would translate into dramatic gains in profits and cash flow. We believe that a demonstration of improving earnings has the potential to be an important catalyst to generate interest in the sector.
Gold Price: Higher from Here?
A second catalyst favoring gold stocks would be more widespread recognition that gold bullion’s strength is not a fluke and that the current level is either sustainable at current levels or that significant upside potential remains. At this point, one can only speculate on the reasons for the behavior of gold bullion. There are many interrelated forces at work to explain the slump in the U.S. dollar (USD) relative to the gold price. However, in our opinion, the most obvious is a general loss of trust in the USD as a store of value and U.S. Treasury bonds as a safe asset.
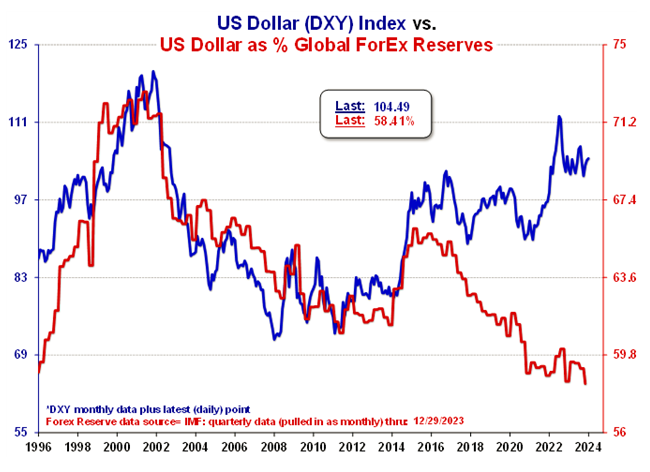
Widespread evidence includes record purchases of gold by central banks replacing U.S. dollars and other paper currencies for bullion at a record level in 2023 (1,037 tonnes). For central banks, unlike mainstream investors, the math on the U.S. fiscal situation dictates immediate action. The $168 billion increase in U.S. government debt over the last 20 days equals the entire U.S. deficit in 2002, as noted by Fred Hickey in the 4/02/2024 High Tech Strategist. By year-end, interest on the national debt is likely to be the largest single U.S. government outlay, according to Bank of America chief market strategist Michael Hartnett (FFFT, The Forest for the Trees, 4/06/2024). Non-U.S. investors have been voting with their feet, as the steady decline in the USD as a share of global foreign exchange reserves illustrates (see Figure 5).
Figure 5. U.S. Dollar Share of Global Forex Reserves Drops to Lowest Since Q3 1995: 58.4%
Source: Meridian Macro. Data as of 3/31/2024. Included for illustrative purposes only. Past performance is no guarantee of future results.
While the financial media has taken note of gold’s climb, most commentary does not connect the price action to possible implications for other asset classes. We believe that gold’s ongoing repricing in U.S. dollar terms should not be seen as an isolated curiosity without consequences across the investment spectrum. Gold is a global asset whose superior safety versus bonds has been amply demonstrated since August 20, 2023, when it broke to a new high relative to TLT, iShares 20+ Treasury Bond ETF, as shown in Figures 6A and B.
Figure 6A. Gold versus Bonds (2005-2024)
Source: Bloomberg. Data as of 3/31/2024. Included for illustrative purposes only. Past performance is no guarantee of future results.
Figure 6B. “The U.S. Bond Market has now been in a drawdown for 44 months, by far the longest bond bear market in history.”
Source: Charlie Bilello, X.
Loss of trust in the U.S. dollar as a safe and useful asset is no longer a hypothetical concern. Abandonment of the U.S. dollar is a reality, and the pace is picking up steam. Repercussions for the financial markets and real economy are unlikely to be negligible. There are numerous potential catalysts for the general rush into gold by the investment mainstream. A few include the intractable fiscal position of the U.S., all things geopolitical, a resurgence of inflation connected to rising oil prices, a steep recession, an impotent and mistake-prone Fed, an unnerving setback in the overvalued and an over-concentrated stock market, or a combination. The investment public remains asleep to the risks. Yet the breakout in gold bullion could signal the possibility of a significant reset of world financial markets.
Until there is a reset in consensus investment expectations, we believe gold bullion strength will likely be dismissed as a sideshow of little import beyond the world of precious metals. In our opinion, the story behind the breakout in the USD gold price has yet to be written. For value investors agnostic to macroeconomic concerns, the proposition is simple: the compelling opportunity is the significant upside offered by precious metals.
1 | Source: Bloomberg. ETFGTOTL Index measure gold-backed ETF holdings totaled 93.135M as of 3/31/2023 and 82.169M as of 3/31/2024. |
2 | VanEck Vectors Gold Miners ETF (GDX) tracks the overall performance of companies involved in the gold mining industry. The SPDR Gold Shares ETF (GLD) tracks the price of gold bullion in the over-the-counter (OTC) market. |