- The US PPI inflation report is today, and the CPI is released tomorrow. The average American is experiencing much more “boots on the ground” inflation than these reports have shown to date, and they are managing it by taking on more debt.
- The Ukraine war has become the quagmire that anyone sane knew it would be, and Gaza is just as horrific.
- In America, the most vociferous chickenhawks (citizens who cheerlead these wars but refuse to fight in them) love watching their government borrow and extort ever-more fiat to fund the madness.
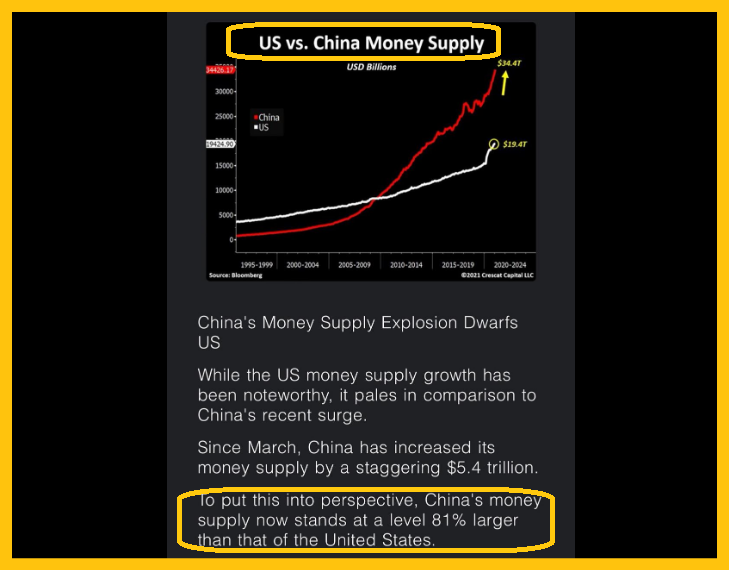
It appears that money printing in China has surpassed even the ludicrous numbers showcased by the United States.
- The bottom line: All fundamental lights are green for gold!
What about the technical picture? Double-click to enlarge this key weekly gold chart. Gold’s price action is quite boring even though a bull flag may be in play. It could play out as indicated or simply morph into a “consolidatory blob”.
- Note the fiat dollar and US interest rates at the top of the chart. They have both formed very loose and rough top patterns. The sticky inflation reports (and huge Main Street inflation), overvalued stock market, and endlessly bungled wars keep the dollar in safe-haven mode versus other fiats…
- But they all look pathetic compared to gold.
- After a big move up or down in any market, it’s natural for investors and analysts to try to predict what comes next.
- That’s a mistake.
- Professional investing is mostly about preparing for surprise and staying calm when the crowd gets excited.
Double-click to enlarge. On the daily chart, the price action from the February and March lows isn’t quite vertical enough to call the current action a flag, but it is a very bullish drifting rectangle.
Double-click to enlarge. On the short-term chart there is inverse H&S action. That’s bullish.
- Tactics? Gamblers can buy here to bet on a bullish PPI report and the bullish technical patterns on the chart.
- Investors should be prepared to back up their golden trucks at $2150-$2080.
- It’s unlikely that the price goes there for many years, but if it happens, COMEX commercial traders and Indian dealers will likely buy there with “other worldly” aggression. Gold bugs of the world need to be ready to do that too.
Double-click to enlarge this key US stock market chart. A double top is possible, but from a seasonal perspective, early August is the most likely time for a major meltdown to commence.
- That opens the door to the formation of an ominous H&S top, with a left shoulder fully formed now.
- The stock market has been bid up on hopes for the Fed to cut rates back down towards the zero marker. If inflation gets any stickier than it already is, Jay may have to announce a rate hike rather than a cut!
- That would create a situation like that of the 1970s, with rising inflation, rising rates… and soaring gold!
- Chinese futures market gamblers have been subdued since a margin hike was announced in April, but a new wave of US inflation would likely see them come back into the market.
Double-click to enlarge. All the silver charts are incredibly bullish. This adds weight to the “1970s on steroids” thesis. Also, main street investors tend to like lower priced items, and silver is currently only a fraction of the price of gold.
Double-click to enlarge this ultra-bullish GDX chart. A surge to $40 (and then $43) would be a near-certainty if there’s a close above $36.
- There’s no guarantee that it plays out as indicated, but all gold stock investors should cheer that it does!
Thanks!