Gold prices are retracing from their previous level today as traders take highly calculated risks ahead of the most important economic event, which will unfold later this week. Thus far, the precious metal appears to be following a skewed path of least resistance towards the upside, characterized by more gradual moves. The yellow metal's prices are more than likely to continue to consolidate ahead of this event, as investors want more clarity before going big.
Background
Gold prices are down nearly 1% today, giving up most of their gains from yesterday as investors continue to digest mixed messages from the Fed members. Over the past few weeks, we have received mixed messages from the FOMC members, with some suggesting that the prospects of further rate hikes may not be imminent. These hawkish members continue to argue that inflation in the country is running hot and that it is acting highly stubborn. These hawkish members maintain their belief that inflation will likely take another year to reach the Fed's targeted 2% level, and if the Fed aims to reach this level earlier than expected, they may need to consider another interest rate hike. Their commentary has certainly made gold traders a lot more cautious, who have been thinking that the only path with the least resistance for the gold price is to move higher as the Fed is very much bound to cut rates.
However, the Chairman of the Federal Reserve hasn’t indicated that there is a serious need for another interest rate hike, and in his latest commentary, he tried to send this message between the lines for traders. Investors are aware that the US economy remains robust, indicating that the risk of a hard landing, which many economists have been advising against, is minimal to non-existent. However, there exists a counterargument, bolstered by the US labour data, which indicates a slowdown in the US employment market. In this context, the upcoming report on Friday holds significant importance.
Goldilocks Scenario for Gold
On Friday, we have the most important economic report coming, which will dictate trading not only on that day but also set the trend for the remaining month. The report that traders are eagerly waiting for is the US NFP data, and the expectations for this report are 189K, while the previous number came in at 175K.
Now, the goldilocks scenario for the yellow metal will be if the report comes in much softer than anticipated. Traders would then expect the Fed to initiate the rate-cutting process sooner rather than later, as maintaining higher rates for longer due to the confidence in the strength of the US labour market would no longer be sustainable. Conversely, if the economic data exceeds expectations, it suggests that the Fed will extend its rate hike policy, potentially leading to an economic downturn. This could prompt traders to repurchase gold as a risk hedge. Another scenario, which is not the goldilocks scenario, is that if the key takeaway from the bullish report or a strong report becomes that the Fed is fine in maintaining their policy and the dollar picks up steam, the gold price drops.
The Price Action
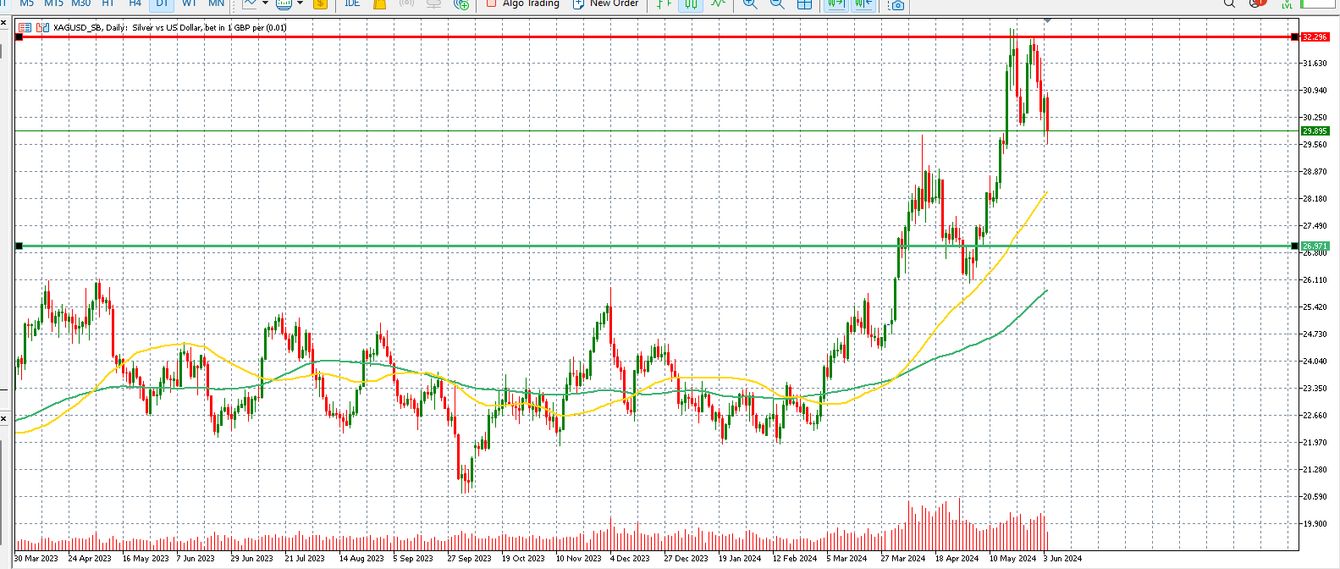
In all scenarios, there are a number of important levels that traders need to be aware of. Firstly, monitor the 100 and 50-day simple moving averages in relation to the price action. If the price continues to trade above them, that would be a highly bullish signal, implying that the price is more than likely to move higher towards the red line—the resistance zone. However, if the price falls below the 100 and 50-day simple moving averages, then we are more than likely to see a correction, which could push the price towards the support zone—shown by the green horizontal line.