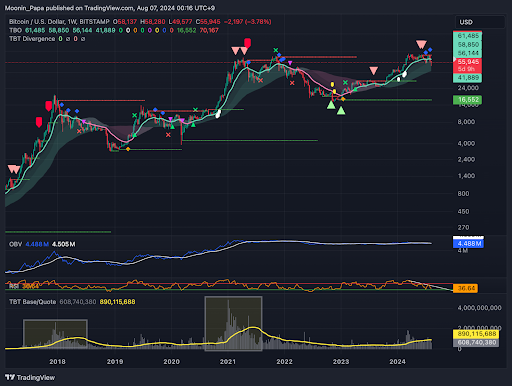
As the crypto markets experience what the Crypto Fear & Greed Index labels "extreme fear," it's important to analyze several aspects before giving into whatever the Fear & Greed index says. Recent developments suggest that the worst of the crypto downturn might be behind us, despite the lingering anxiety.
Market Sentiments and Reactions
Over the past weekend, Bitcoin witnessed a significant sell-off triggered by the "Sahm Rule" following a negative reception to the latest jobs report. This event underscores the sensitivity of cryptocurrency markets to macroeconomic indicators. However, today marks a slight recovery, with Bitcoin's price stabilizing at a key resistance level previously noted as daily support around $56,300.
Technical Analysis: RSI and Price Movements
Interestingly, the Relative Strength Index (RSI) recorded a low of 12.97 yesterday, not dipping as low as the 10.43 seen on June 24th. Typically, such readings might spell further trouble, but the context here suggests a stabilization, potentially good news for market participants. Keep in mind that there is still a strong possibility of heading down to the $50,000 mark again over the course of this next week. Another drop to the 0.786 Fibonacci level (but not exceeding Monday's lower wick) could be the second chance to buy Bitcoin at a discount investors and traders are waiting for.
Despite a minor rebound, Bitcoin's price tested new lows at $53,000 on July 5th, indicating that we are not entirely out of the woods. Such fluctuations are common following major market movements, with corrective candles often appearing after significant price drops. Historical patterns suggest that after a sharp decline, the market tends to consolidate with sideways movement before establishing a clearer direction, shown with the arrows in the provided chart.
Volume Analysis and Market Dynamics
A look at the weekly trading volumes reveals a concerning trend (no pun intended). The volumes we're seeing today pale in comparison to the peaks we saw during the major bull markets in 2018 and 2021. While this chart is for just one single exchange (Bitstamp), the activity we're seeing on this chart could signal a lack of investor confidence or a wait-and-see approach amidst broader economic uncertainties instead of the "bull train" leaving the station, which many influencers are sharing with their followers.
Global Economic Influence
Current global events, including the recognition of a recession in the U.S. and escalating conflicts in the Middle East, add layers of complexity to the already volatile market. These factors contribute to a cautious outlook for Bitcoin and other cryptocurrencies, with potential implications for precious metals and broader financial markets.
Strategic Considerations
For those looking to navigate these turbulent waters, here are some things I am focusing on:
- Accumulating more Bitcoin and taking profits quickly on every (and any) price bounce
- The principle of Dollar-Cost Averaging (DCA) should be applied thoughtfully in pre-determined increments, which prevents me from going "all in" on market dips
- Watching for key signals on daily RSI and price action to determine when Bitcoin will be heading toward the open CME Gap at $62,470
Final Thoughts
While the market presents numerous challenges, staying informed and agile will be key to navigating this period. As we continue to monitor these developments, remember that strategic patience often pays off in the complex world of investing.