

1. Bitcoin Technical Outlook
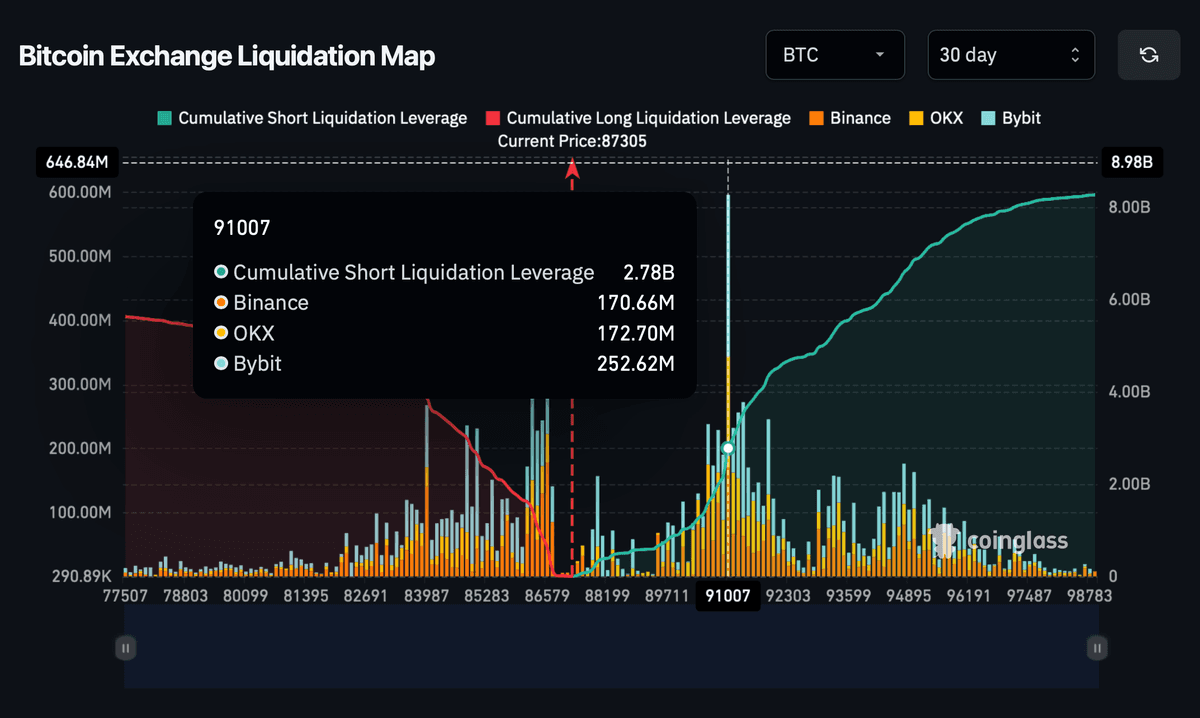
Bitcoin remains below the daily TBO Cloud in a strong bearish configuration, with the fast line frequently tagged by upper wicks this week and the slow line continuing downward. On‐Balance Volume’s moving average has flattened, suggesting the market may be primed for a volume‐driven green candle once holiday trading resumes. On the weekly chart, a TBO Open Short is in progress—confirmation of this would complete the TBO Bear Formula and cement the bear market thesis.
Key resistance lies at the $91,000 sell wall, backed by $2.78 billion in short liquidation risk around $91,007 and maximum pain near $91,116. A push through this zone could drive BTC toward $100,000, though participants should view any sustained gains as a potential bull trap. Overhead resistance at approximately $92,000 remains untested.

2. Ethereum Correlation and Reversal Potential
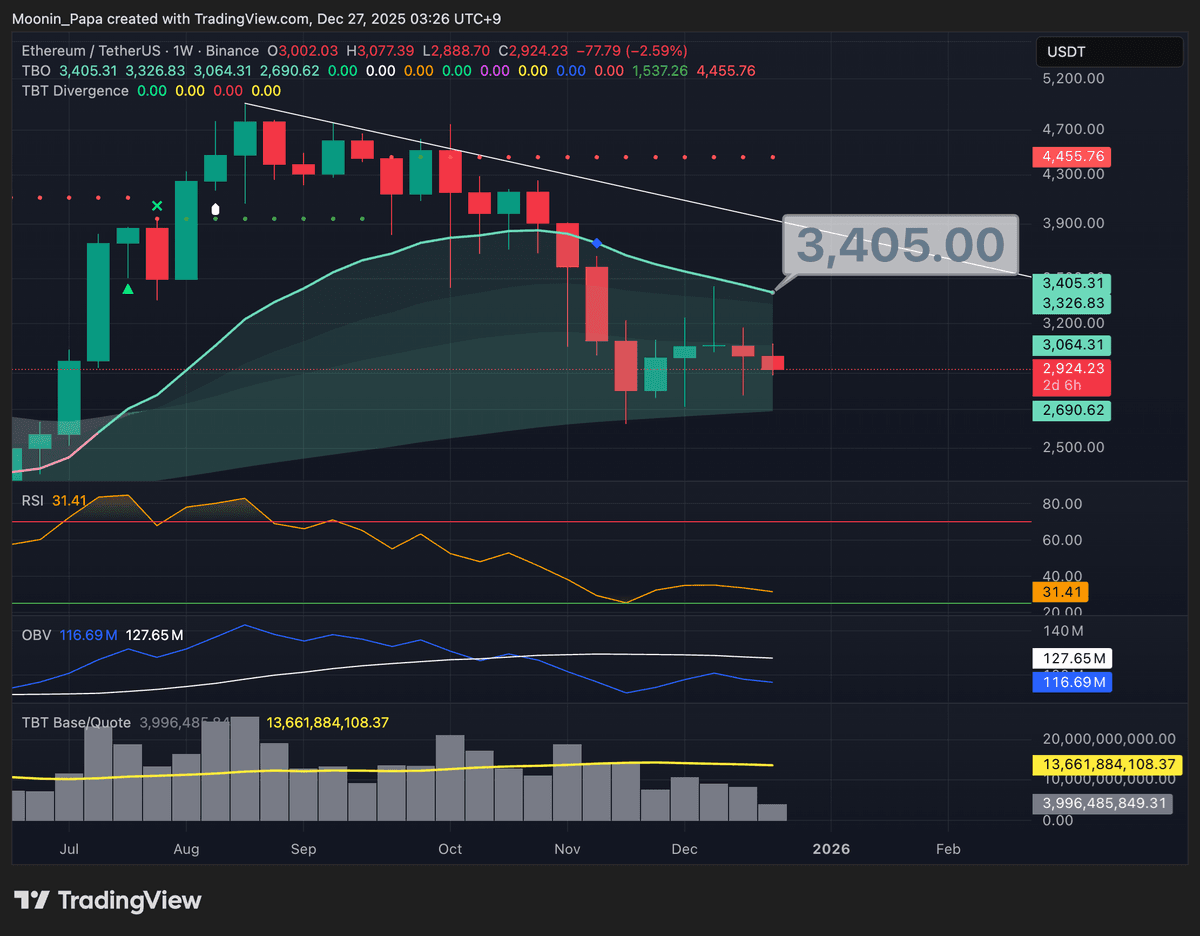
Ethereum is trading below its daily support line and the TBO Cloud in a strong bearish trend, with RSI, OBV and volume all subdued. However, OBV’s moving average has flattened, indicating that a surge in volume coupled with green closes could trigger a short‐term reversal. Should Bitcoin break above $91,000, ETH may follow to its weekly fast line at $3,405.
Outperformance by ETH could also propel the ETH/BTC pair toward TBO resistance at 0.03615, setting the stage for a broader altcoin rally if the wider market confirms a bullish turn.
3. Market Dominance Indicators
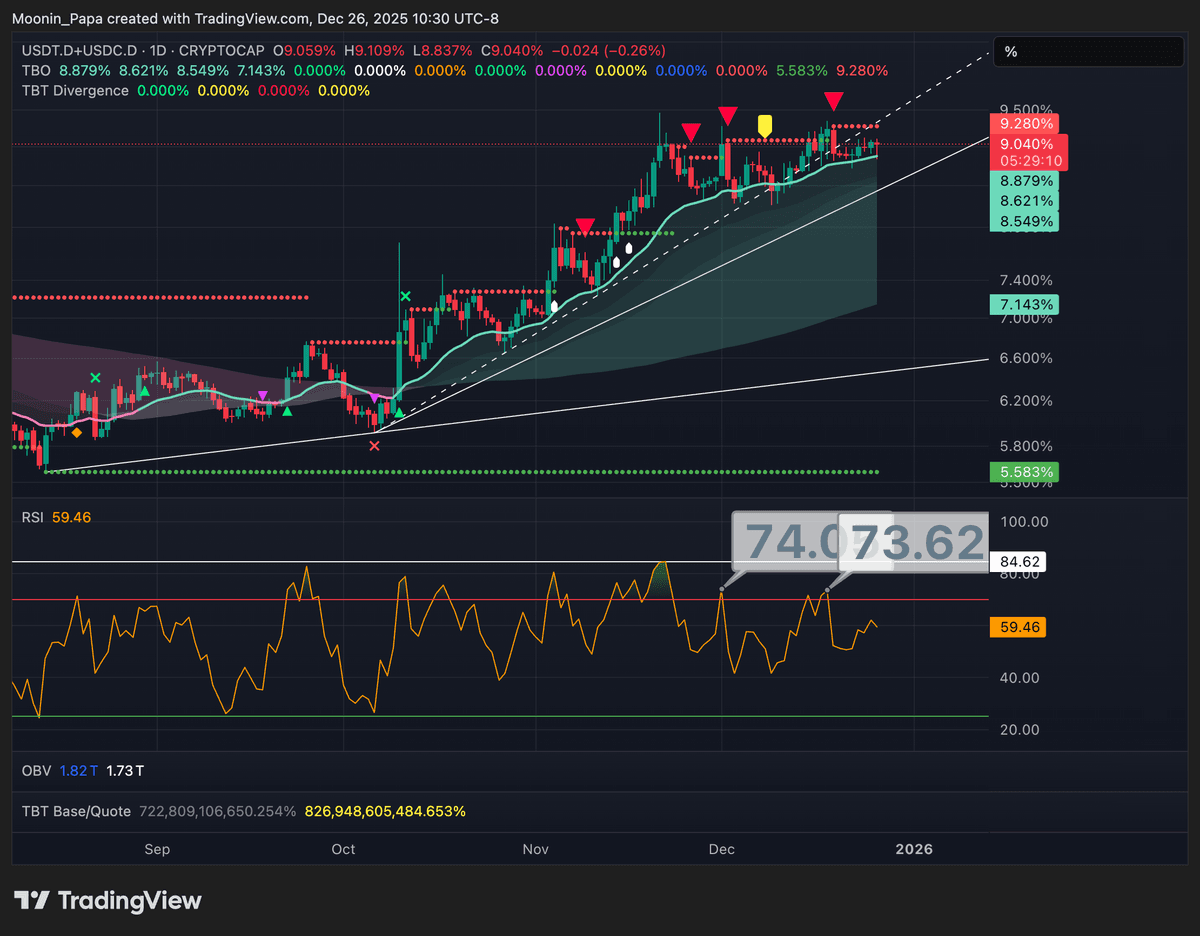
Combined stablecoin dominance remains in a strong bullish phase but displays several wicks into the fast line and a failed RSI high, signaling mounting weakness. A decisive break above $91,000 in Bitcoin price would likely drag stablecoin dominance back into the daily cloud, serving as the first domino in a broader market reversal.
Meanwhile, Bitcoin dominance (BTC.D) sits above its daily cloud with a fresh RSI high, but flows are expected to shift into OTHERS.D—currently oversold and printing a TBT bullish divergence. Total market cap charts mirror Bitcoin’s setup, with TBO Open Shorts in progress on weekly timeframes and emerging TBT bullish divergences on Total E50 and OTHERS, historically preceding 10–12% rallies before resuming downward trends.
4. Traditional Finance and Macro Signals
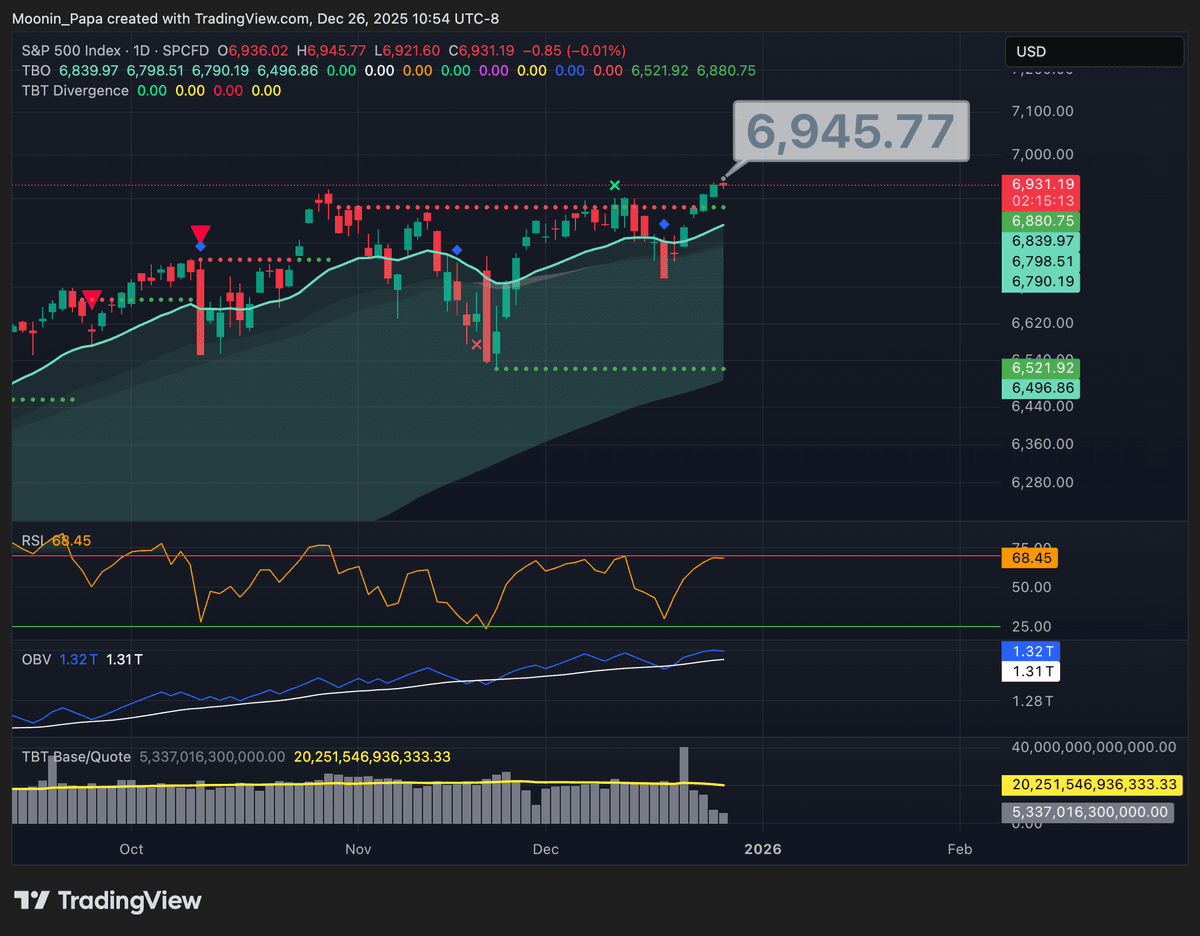
The S&P 500 reached a new high at 6,945.77, yet the Dow Jones Industrial and NASDAQ 100 have not confirmed this advance, and the FANG Index remains in bearish consolidation. NVDA’s recovery above the daily cloud appears to be the primary driver of the S&P push. The VIX plunged to 13.64, just above TBO support, indicating a near absence of fear and warranting caution.
In Asia, the Nikkei is recovering above its daily cloud on low volume, the Shanghai Composite confirmed a TBO Open Long and reclaimed its cloud, while the Hang Seng remains range‐bound. These mixed signals suggest global markets are vulnerable to abrupt shifts as liquidity thins over the holidays.
5. Precious Metals and Commodities

Precious metals continue to outperform expectations. Gold’s daily RSI hit 93.12, pointing toward a target near $4,781. Silver cleared the $74 1.272 Fibonacci extension, and platinum surged 8% intraday. Conversely, copper (XCUUSD) is forming a three‐bar TBO breakout cluster high above prior highs—often an exhaustion signal—so traders should monitor for a potential top.
6. Altcoin Divergences and Caution
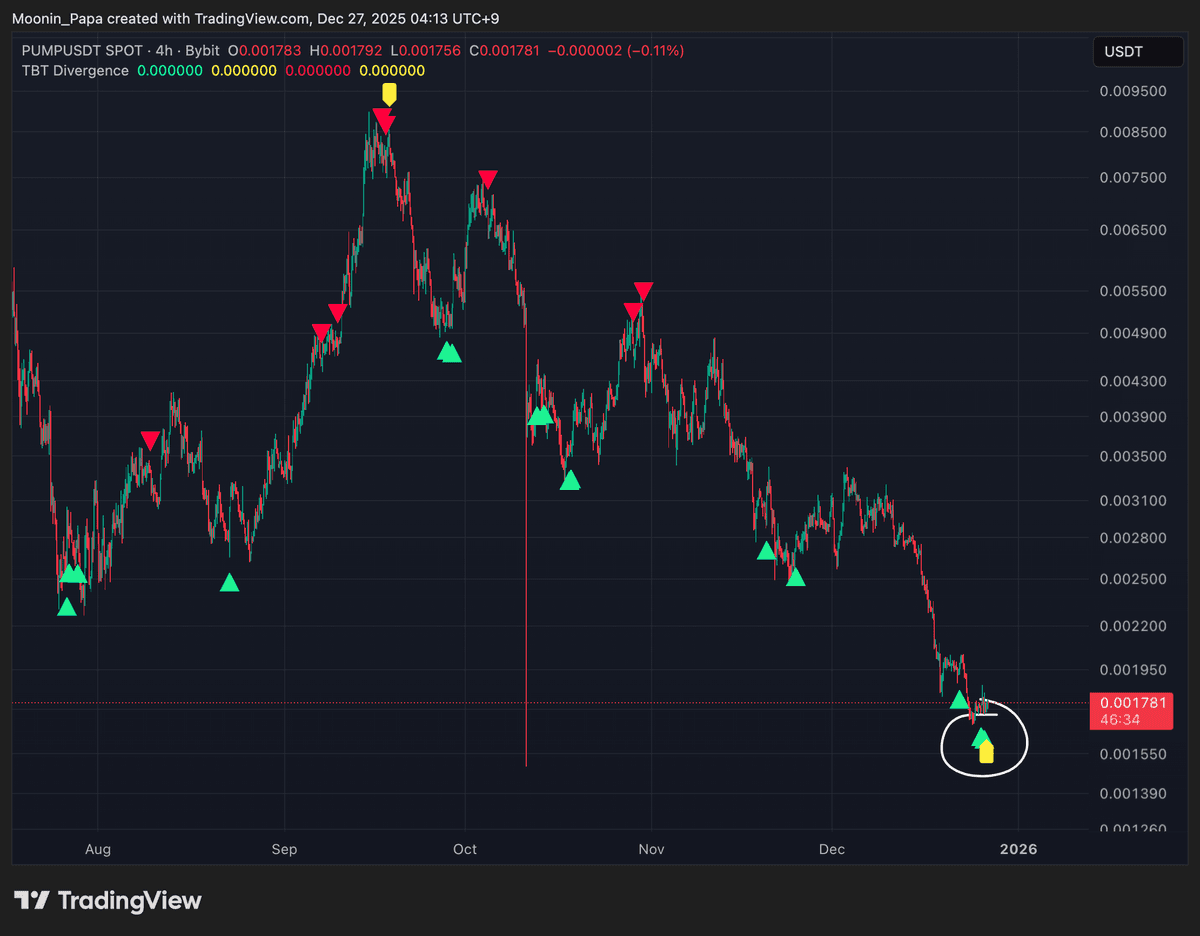
Numerous altcoins display bullish divergence clusters on shorter timeframes—PI, PUMP, COAI and AVAX among them—while NEAR and DASH show strong consolidations. BCH has returned to daily TBO resistance at $597, and LDO and XPL are nearing fast‐line tests. However, all major altcoin charts maintain macro bearish trends via descending TBO slow lines.
Given the potential for a bull trap, any rally in altcoins should be treated as an opportunity to exit positions. Historical patterns from 2018 and 2022 suggest short‐term bullish reversals may precede continued downside toward weekly TBO confirmations.
Learn my strategies and the tools I use every day by visiting The Complete Cryptocurrency Investor by Mastering Assets.
