
On Friday, Silver broke through the $ 100-per-ounce mark, creating a perfect storm of conditions that could drive the market to unprecedented levels. Several factors contributed to the recent surge, including a multi-year supply-and-demand imbalance, booming industrial demand (especially for EVs, AI, and solar), rising investment demand, and increased geopolitical risks, all of which could point to another extension higher.
Silver has already risen by more than 40% in 2026, reflecting a broad repricing of metals. The continued buying of Gold by central banks and the inflow of private investments into exchange-traded funds (ETFs) are key structural factors that could support both Gold and Silver. These trends could potentially boost Silver prices to $150 and Gold prices to $5,500.
To help you develop a trading plan, I reviewed 25 years of my trading strategies and created a free resource: the "5-Step Technical Analysis Guide." This guide outlines all the technical analysis steps you need to create an actionable plan for entering and exiting the market. You can request your copy here: 5-Step Technical Analysis Guide
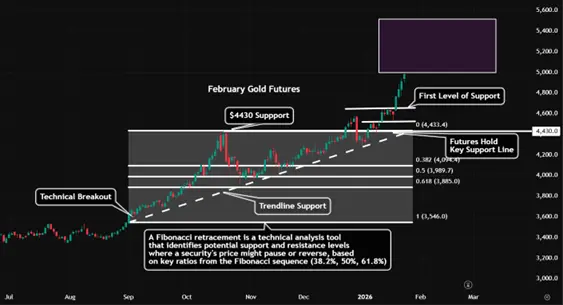
Daily Gold Chart

Daily Silver Chart
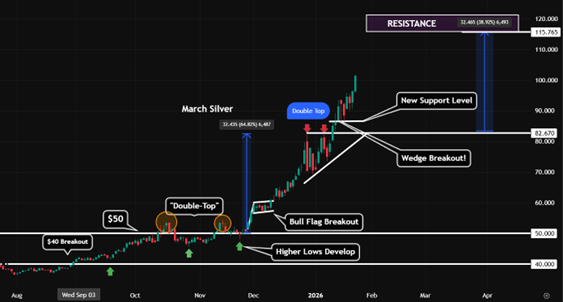
Silver continues to experience a remarkable surge, reminiscent of Gold's performance, and follows several key technical analysis principles. After breaking through critical resistance levels at $50 and rising to $82 per ounce, futures reached a double top before forming a bullish pennant pattern. This bullish pennant eventually broke, fueling the rally and pushing prices above $100 per ounce.
Currently, there is a clearly defined trading range between $50 and $82. After a period of consolidation, we could see another extension of $32 higher, potentially pushing prices into the $115 to $120 range. We believe that a breakout above the $115 to $120 range could set the stage for prices to reach $150 per ounce, later in the year.
Example Silver Options Strategy
We firmly believe that a "Commodities Supercycle" is currently underway, and Silver is now facing its fifth consecutive year of deficit, and a squeeze is underway. To prepare, we are constructing long-dated call spreads in the Silver market for our clients.
For Example purposes only, one could purchase the August 2026 Silver futures $130.00 call option while selling an August 2026 Silver futures $140.00 call against it. The plan will create a calculated risk Bull Call spread and costs $7,500 plus any commissions and fees, while your maximum gain would be $50,000, less your initial cost, if silver futures close above $140.00/oz at expiration on July 28, 2026. We believe this strategy achieves a low-risk high reward profile. Staying ahead of the Silver market has never been easier. Get the Blue Line Futures Precious Metals Chart Pack today by registering here: Get Precious Metals Chart Pack
Performance Disclaimer
Hypothetical performance results have many inherent limitations, some of which are described below. No representation is being made that any account will or is likely to achieve profits or losses similar to those shown. In fact, there are frequently sharp differences between hypothetical performance results and the actual results subsequently achieved by any particular trading program.
One of the limitations of hypothetical performance results is that they are generally prepared with the benefit of hindsight. In addition, hypothetical trading does not involve financial risk, and no hypothetical trading record can completely account for the impact of financial risk in actual trading. For example, the ability to withstand losses or to adhere to a particular trading program in spite of trading losses are material points that can also adversely affect actual trading results. There are numerous other factors related to the markets in general or to the implementation of any specific trading program that cannot be fully accounted for in the preparation of hypothetical performance results all of which can adversely affect actual trading results.