Divergence has been the name of the game this week, with the Gold/Silver ratio pressing back to 2024 highs at 92:1. Something I noticed from the last time we were trading at this level on January 22 was a large buyer emerged in the SLV ETF increasing the number of shares by 17,700,000 to a total number of shares outstanding at 490,100,000. Coincidently, within 24 hours, China announced a new round of stimulus, pushing Silver up 8% over five trading days. Was this luck? I suspect that it is not and will repeat.
Shifting our focus to Gold, something big is setting up again, and a material shift is happening in the background. Of course, prices have not materialized in either direction, and we have consolidated since the start of 2024. From a short-term perspective, better-than-expected economic data and Central Bankers maintaining a "higher for longer" stance have adjusted the Fed's forward rate path, driving short-term price movements. Depending on whether you are overweighted on Gold or just losing patience in the lack of upward direction, you are not alone. ETF outflows from GLD have continued for 15 straight days.
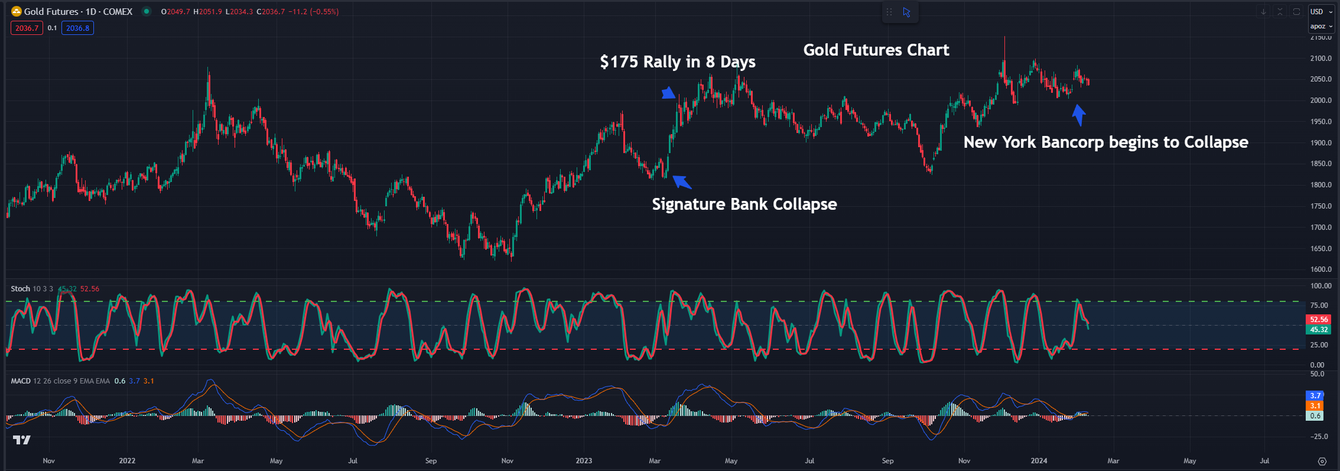
Over the long run, the timing, pace, and depth of the interest rate cuts will ultimately drive the trajectory of higher Gold prices. However, we expect the news of New York Bankcorp's deteriorating conditions in its commercial real estate portfolio will pull forward the Fed's first rate cut ahead of its perceived schedule. Remember, the Fed doesn't just cut rates without a negative catalyst. They cut as a reaction function to a negative U.S. economic situation, and I believe the dire situation in Regional Banks will be another repeat of March 2023.
The KBW Regional Bank Index year-to-date is down 3.28%, Western Alliance Bancorp is down 8.4%, Valley National Bancorp is down 24%, and New York Community Bancorp is down 56%.
Rewinding to March 2023
To help you develop a technical trading strategy, we have recently updated our "5-Step Technical Analysis Guide," which will provide you with all the Technical analysis steps to create an actionable plan used as a foundation for entering and exiting the market. You can request yours here: New 5-Step Technical Analysis Guide.
Gold futures opened on March 9 at $1818; by March 12, Signature Bank had fallen; by March 13, Gold closed at $1918, a complete $100 higher. News of more banks circulated, and by March 17, Gold was at $1993, a full $175 higher!
According to the CME FedWatch tool, a March rate cut sits at 17.5% and if inflation continues to trend lower while the labor market cools without deteriorating, the Fed will use the news of a new banking crisis to make its first cut. We see them having two options: slower and sooner or faster and later. Historically, when the Fed ended its interest rate hiking cycle and made its first rate cut, Gold futures rallied 6% within the first 30 days.
Having the flexibility to enter and exit the market quickly makes it essential for Precious Metals investors to have a futures trading account alongside their core Physical Precious Metals holdings. If you are interested in speculating on the rise and fall of the price of Precious Metals on a shorter-term basis, such as two weeks or two months, or If you have never traded futures or commodities, check out this new educational guide that answers all your questions on transferring your current investing skills into trading "real assets," such as the 1000 oz Silver futures contract. You can request yours here: Trade Metals, Transition your Experience Book.

