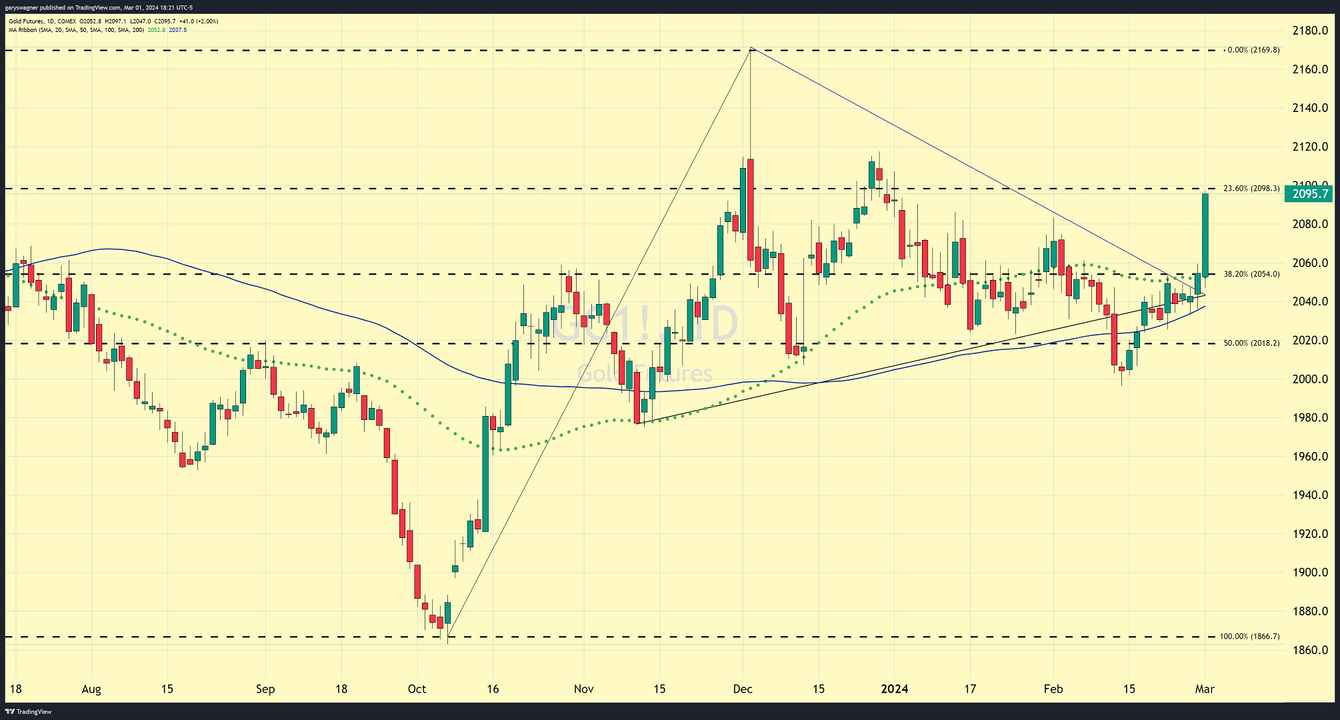
Exceptional, phenomenal, amazing, surprising, astounding, and almost beyond belief are only a few of the many words that can be used to describe today’s exceedingly strong upside breakout in gold futures. Gold opened today at $2052.82 and by the close of Globex at 5:00 PM ET gold futures are up $41. At the close, the most active April gold futures contract is trading at $2095.70, a 2% daily gain.
Now that gold futures have concluded for the week and the first trading day of March, the only regular break to gold’s 24-hour trading day (excluding holidays) market participants, investors, and traders are all beginning to have a more comprehensive understanding and explanation as to why gold moved 2% in a single day. The difficulty here is that there was no unexpected fundamental report or event that led to such a tremendous price gain in a single day.
There was no single news event, expected data report, or even a black swan event (an unpredictable or unforeseen event, typically one with extreme consequences) that could simply answer this question. What we do know is this large of a move does not occur frequently.
Today’s gains were the largest daily gain since Friday, October 13. On that day gold futures opened at $1921.70 and closed at $1983.80 and gained approximately $62 in a single day.
So what we must assume is there is a high probability that today’s spike was caused by events that occurred recently that are just beginning to get digested and interpreted in a new light or different way. The one big similarity to last week’s trading range is that Friday’s gain contained the vast majority of the weekly gain. On a weekly basis, gold gained $46.30 which is a 2.26% gain on the week, of which 2% of that gain occurred today. Last week gold gained $25.30 which is a 1.25% gain on the week, of which $18.70 or 92.1% of the gain occurred last Friday, February 23.
However, that fact delivers very little insight if any at all as to why gold had the single largest daily gain in the last five months.
The chart above is a five-minute Japanese candlestick chart of April gold futures. The first blue arrow on the left marks the beginning of the trading day with gold opening at $2052.82. Approximately 3 ½ hours later gold would trade to its low of approximately $2047 and begin the first leg of two rallies that would take gold dramatically higher. Gold would trade from $2047 up to $2066 in just over two hours before trading to another low of $2051, which was above the daily low and was a precursor to the dramatic second leg of the rally which took gold from $2051 to its high above $2096 before trading sideways are consolidating and currently at $2091.60 its settlement price for the week.
The next chart we want to look at is a five-minute candlestick chart of the dollar index which traded to a high today of 104.324, a low of 103.859, and settled down 0.24% at 103.904. The dollar traded with some volatility today, compared to what was witnessed in gold futures.
The chart above is a daily candlestick chart of gold which shows the incredibly large and dynamic price spike in one single candlestick which more than anything else clearly illustrates the importance and magnitude of today’s single move. All we can say is that most likely it was a combination of many events in which market sentiment shifted. The first and most obvious one to look at would be a renewed belief that the Federal Reserve will cut rates sooner than expected.
This could stem from the latest inflation report coming in close to the anticipated target. But luckily we have the weekend to aggressively analyze and dissect today’s rally so that on Monday we can bring you a more concise attempted understanding of today’s move.
For those who wish to learn more about our service, please go to the links below:
Pricing, Track Record, Trading system, Endorsements of Confidence, FAQ
Wishing you as always good trading