May 7, 2024
- Most US citizens have no savings and are carrying significant credit card debt. While the CPI, PPI, and PCE reports show inflation is in the 3% range, the average citizen feels that costs are rising much faster for them.
Double-click to enlarge. The channel breakout for oil has failed and there's a risk that the price falls back to $67-$64.
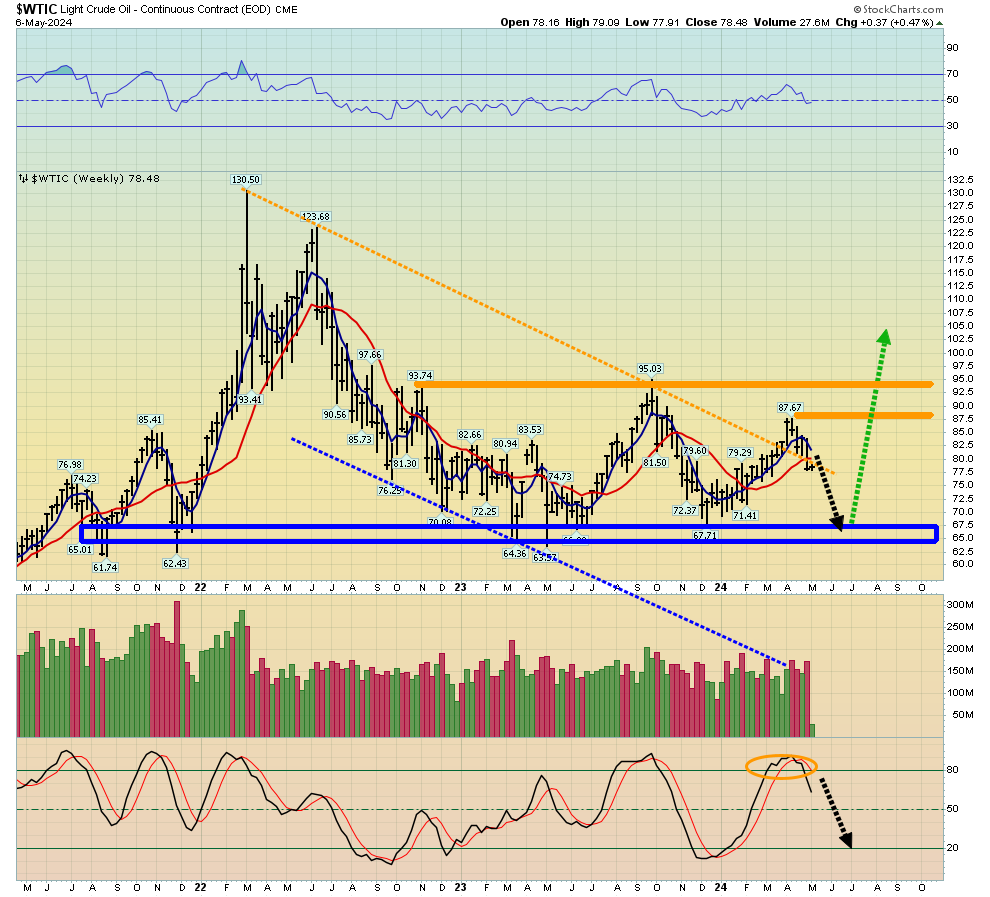
- Does the swoon in oil reflect overwhelmed consumers in America cutting back on their spending and the start of a US economic slowdown? It likely does, and it's happening while the Ukraine military attacks Russian oil facilities and the Israeli military attacks Rafah.
- If those horrific wars weren't happening, oil would likely be crashing towards $40.
Double-click to enlarge. The Dow is likely building some kind of market top.
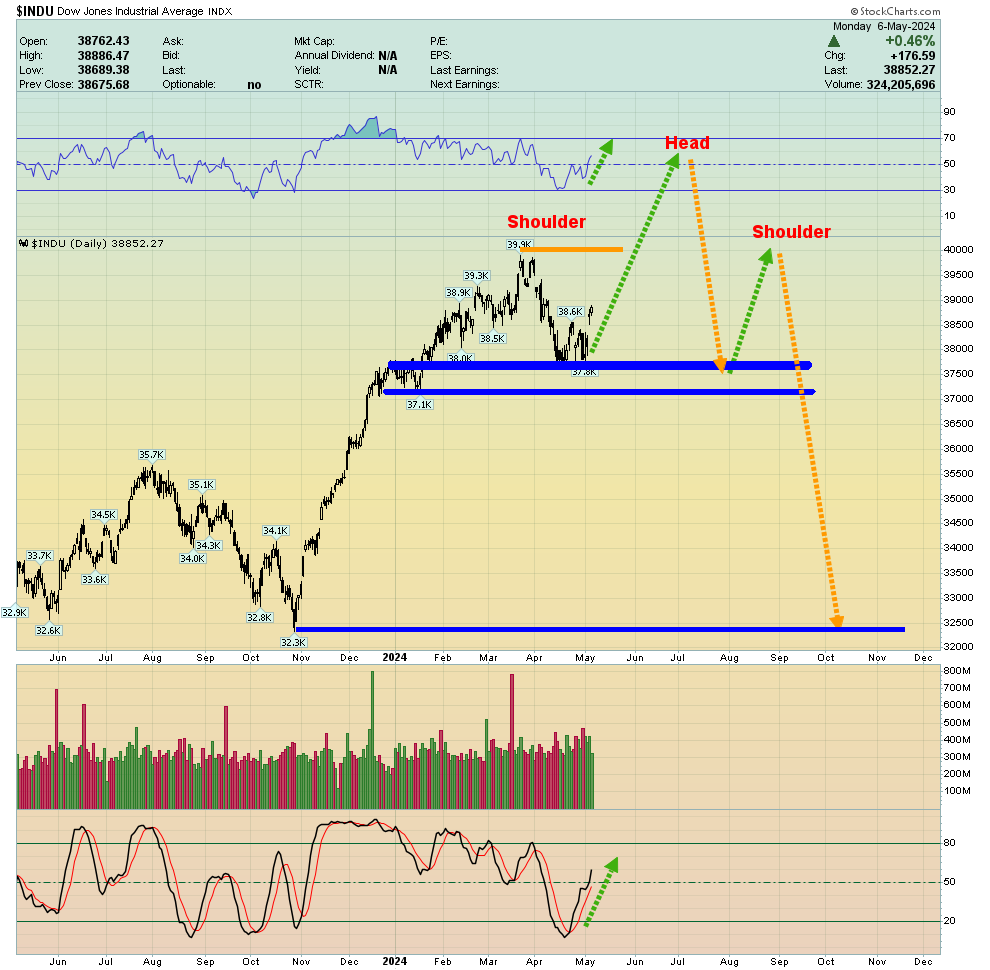
- It could be a H&S pattern or a double top. Regardless, significant carnage looks set to begin as early as August, which is the start of my Aug 1-Oct 31 "crash season".
Double-click to enlarge. US rates also have a big H&S top formation in play.
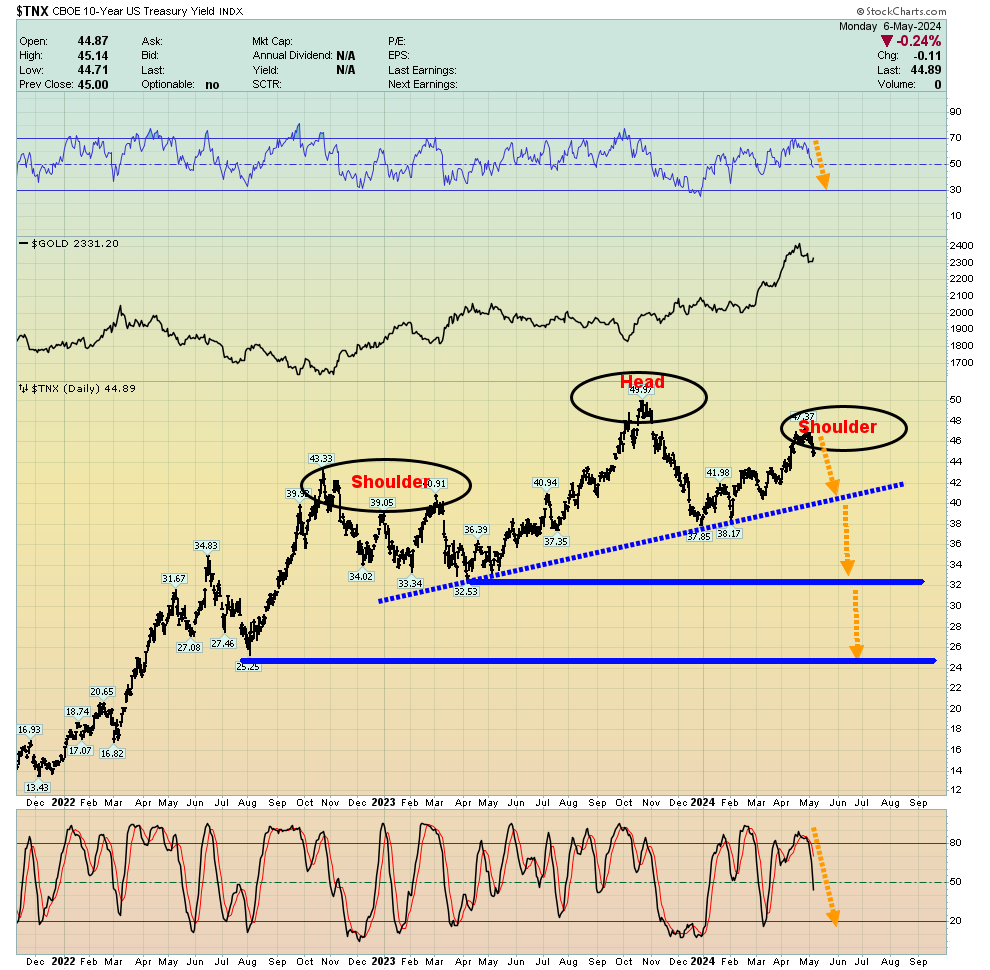
- Interestingly, a collapse in oil could reduce costs for gold and silver miners, making them even more attractive than they already are.
For a look at the US dollar index. The dollar is in a rectangle pattern. Its price action isn't as negative as that of rates and oil.
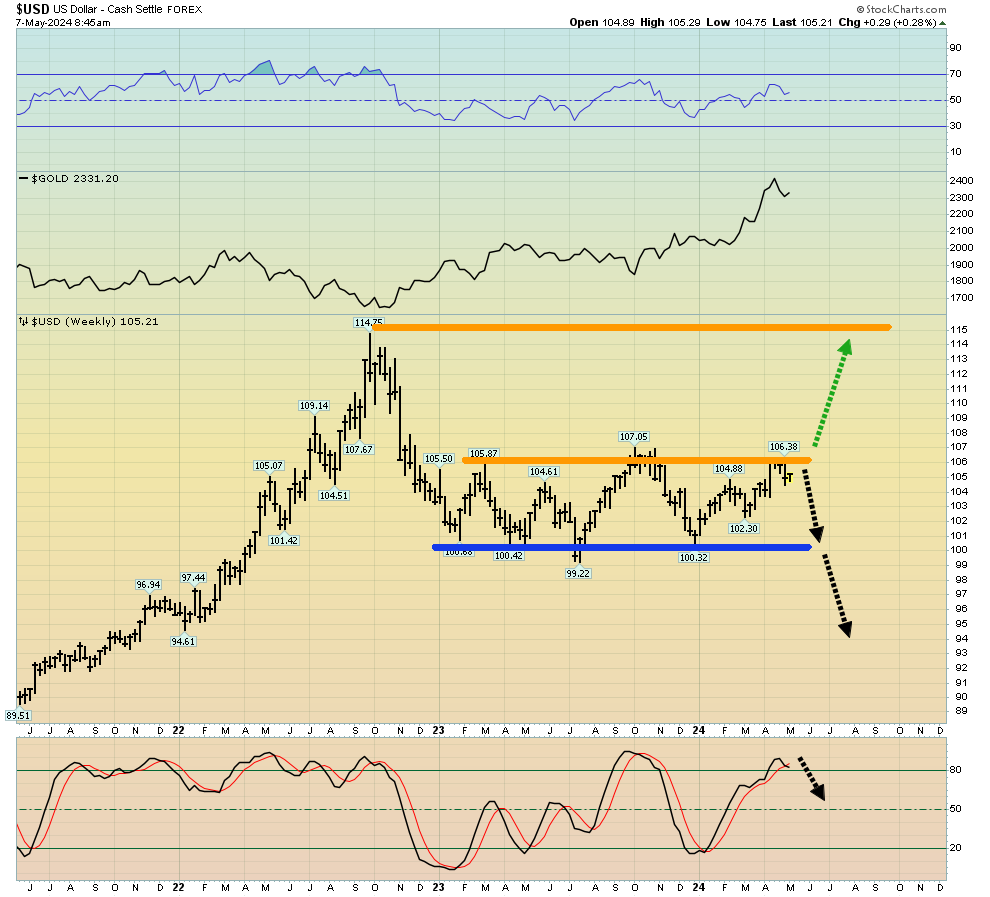
- That's not necessarily indicating a healthy dollar. The price action likely indicates that most Western governments are acting just as recklessly as the US government with their outrageous spending, debt, and war mongering in faraway lands.
Double-click to enlarge this fabulous weekly chart for gold. The flagpole in play could extend before a bull flag finally appears.
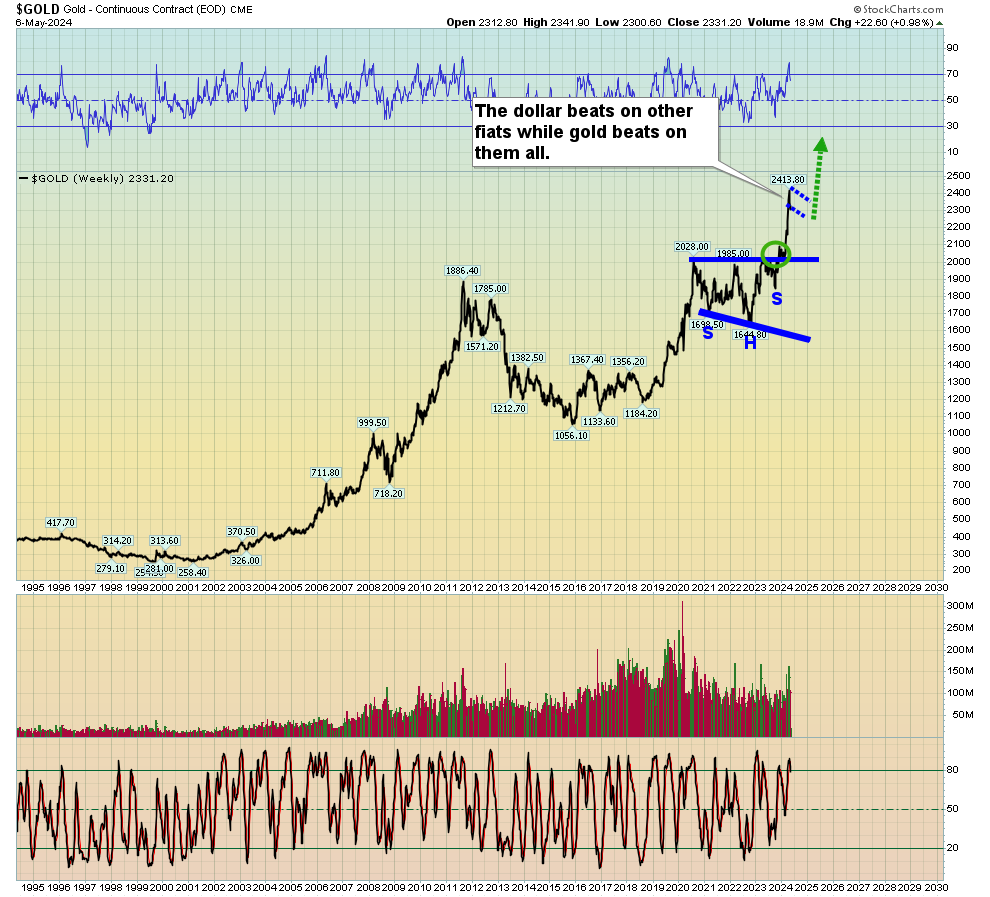
- It appears that many Western gold bugs have begun the transition from trying to make "big fiat profits" with gold…
- To nervously getting into gold before all their fiats look just like the Venezuelan bolivar.
Their nervousness about fiat money is fundamentally justified, and for an enticing look at the daily gold chart. Double-click to enlarge. A bullish flag-like rectangle is in play.
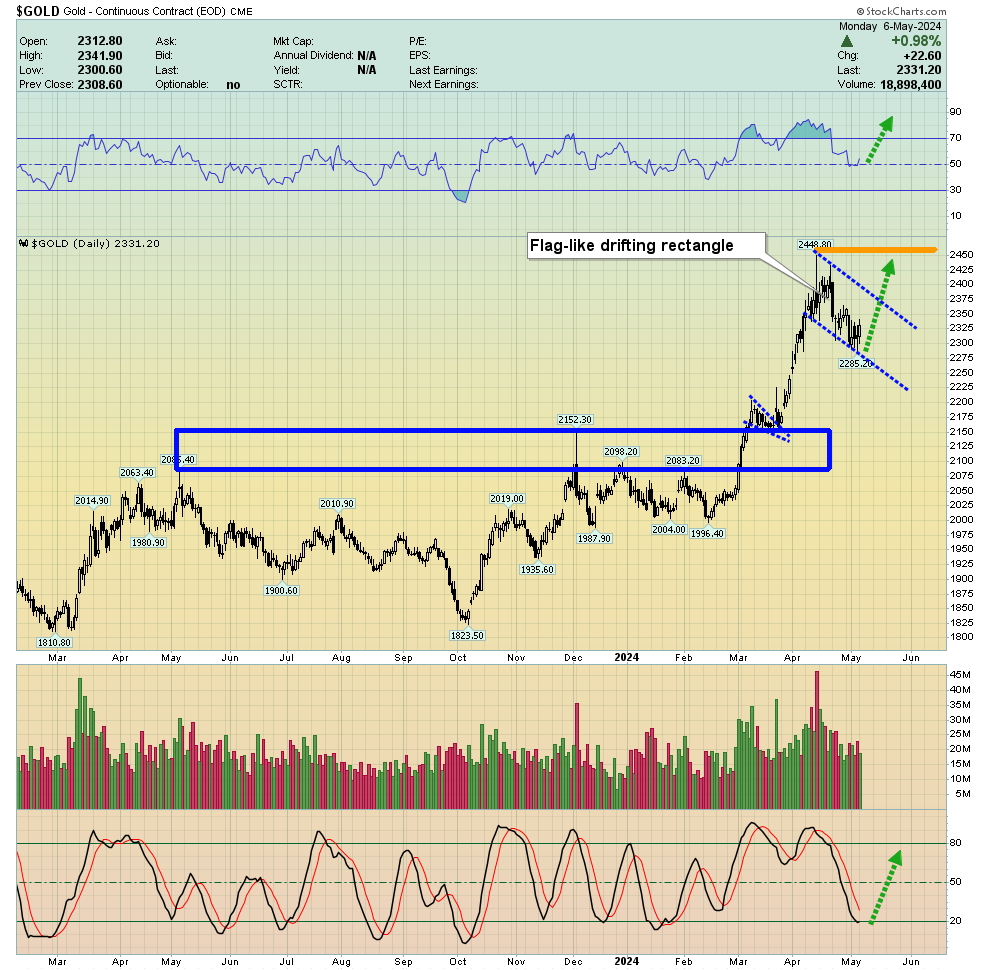
- Note the fabulous position of RSI (at the momentum zone of 50) and the key 14,7,7 Stochastics oscillator (now at the launchpad zone of 20 and starting to turn up).
Silver? It looks even more enticing than gold! For a look at the daily chart. Double-click to enlarge. A massive technical breakout is in play. RSI and Stochastics look fantastic, and there's a fabulous bull wedge breakout as of yesterday's close.
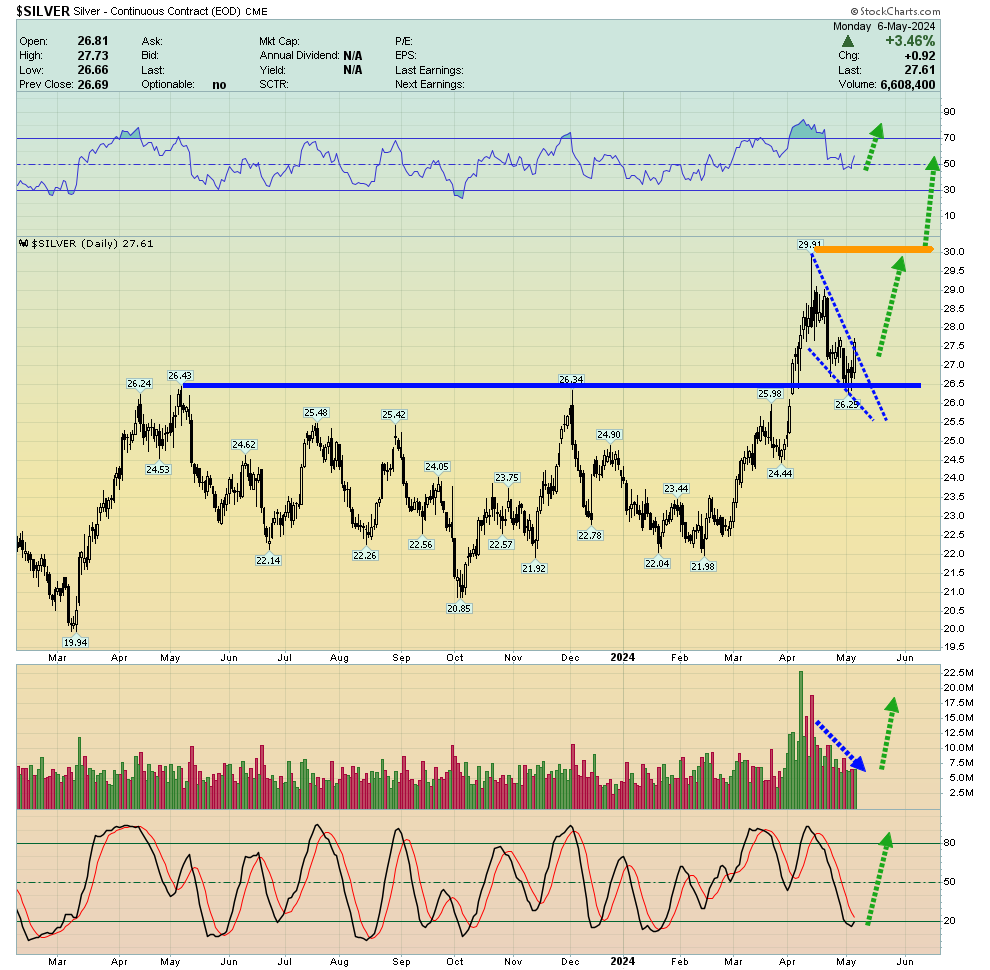
- All that's needed now is a big burst of volume, and silver could charge through the $30 resistance zone like a bull era tank driving through a rancid fiat butter wall.
Double-click to enlarge. While the US stock market carves out a massive top, the Chinese market is breaking out from a major base.
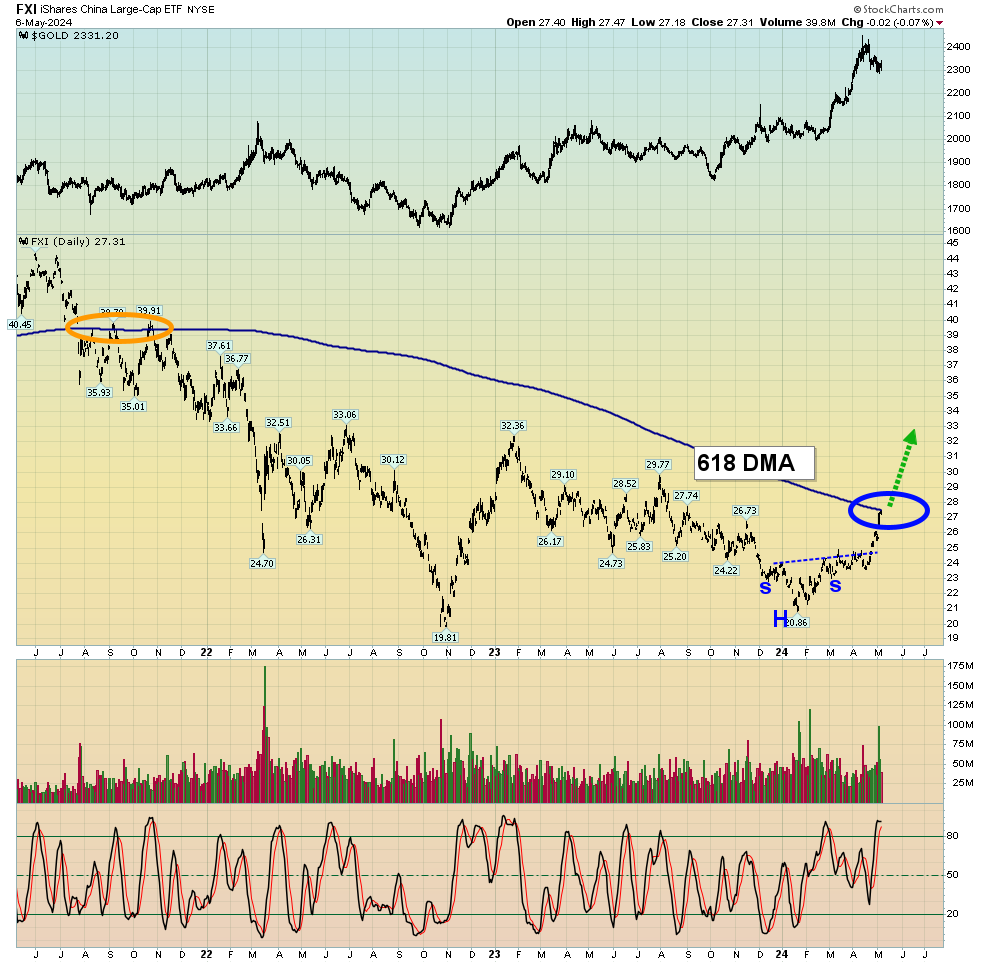
- A move over the 618 DMA (a key Fibonacci number) could mark the start of one of the largest bull runs in the history of markets.
- When Chinese citizens make money in the stock market, they celebrate by buying huge amounts of gold.
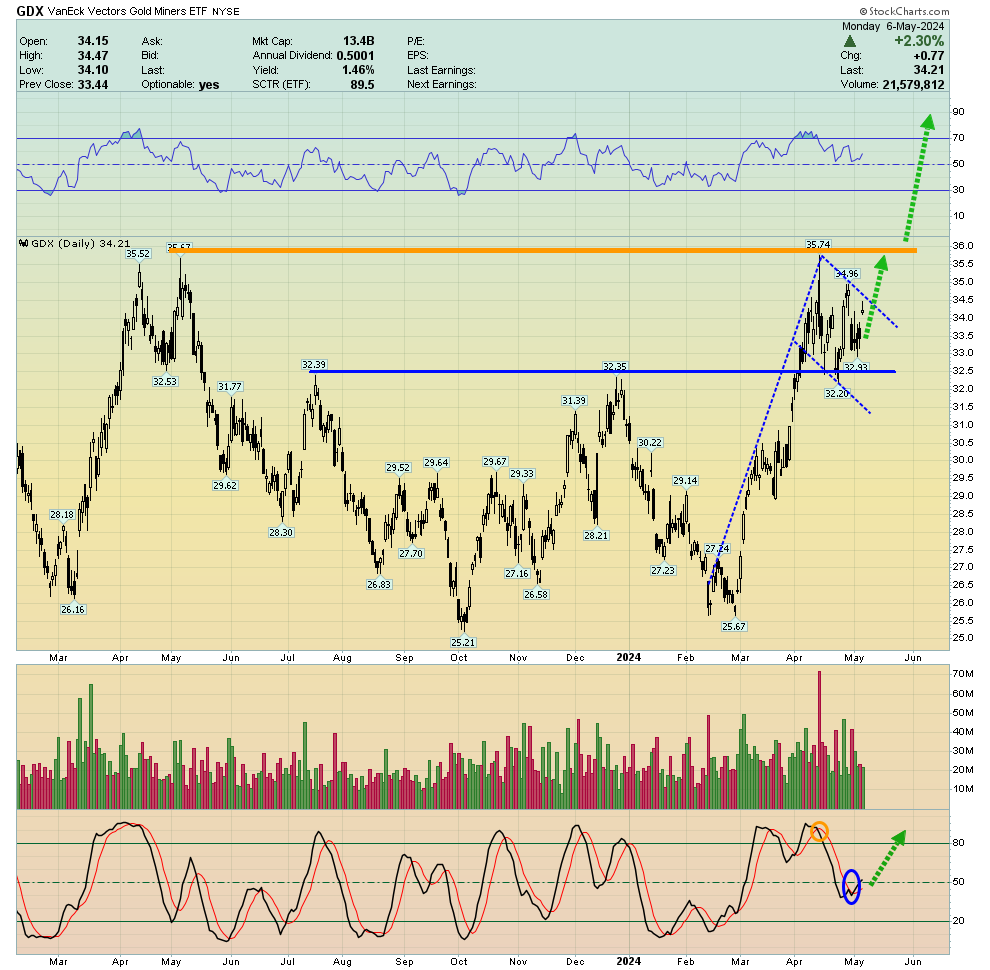
- The miners? Well, as gold arrived at the $2400 area, I suggested a "pause with grace" was in order for the mining stocks, and that's exactly what has transpired.
Double-click to enlarge this GDX daily chart. Technicians can debate whether a drifting rectangle or flag is in play, but both patterns are bullish, so it's win-win for all. Stochastics has turned up from near the momentum zone of 50.
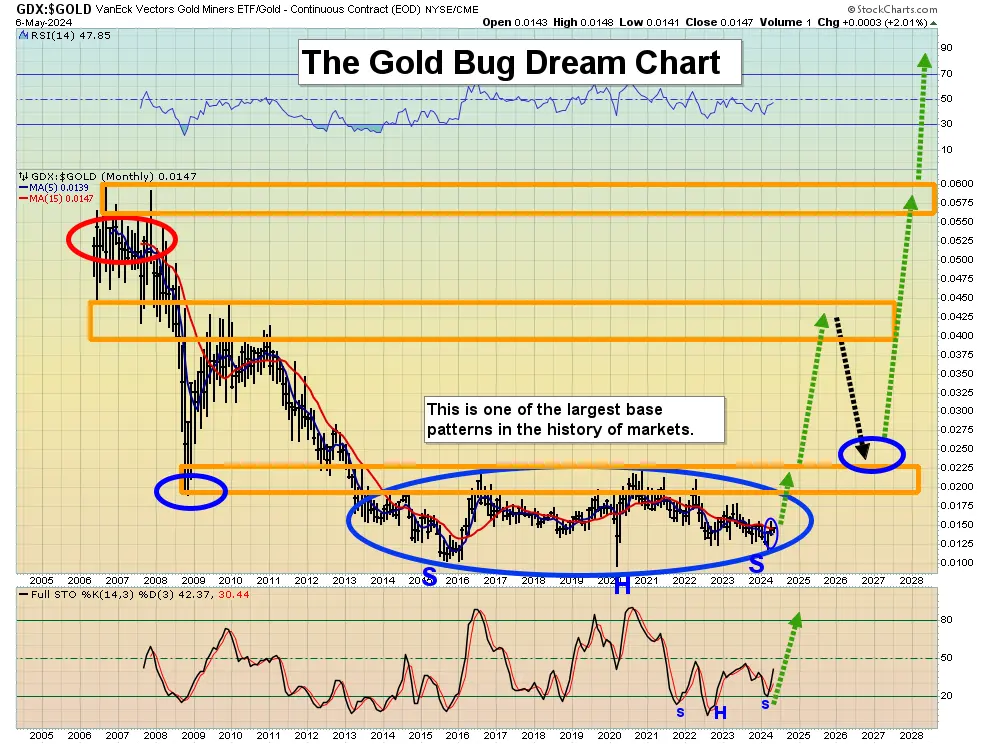
Double-click to enlarge this spectacular gold stocks versus gold chart. One of the largest base patterns in the history of markets is in play, and the rise from the right shoulder low has commenced. It's in sync with what I've suggested will be a Chindian (China and India) citizen-oriented gold bull era that lasts for at least a hundred years.
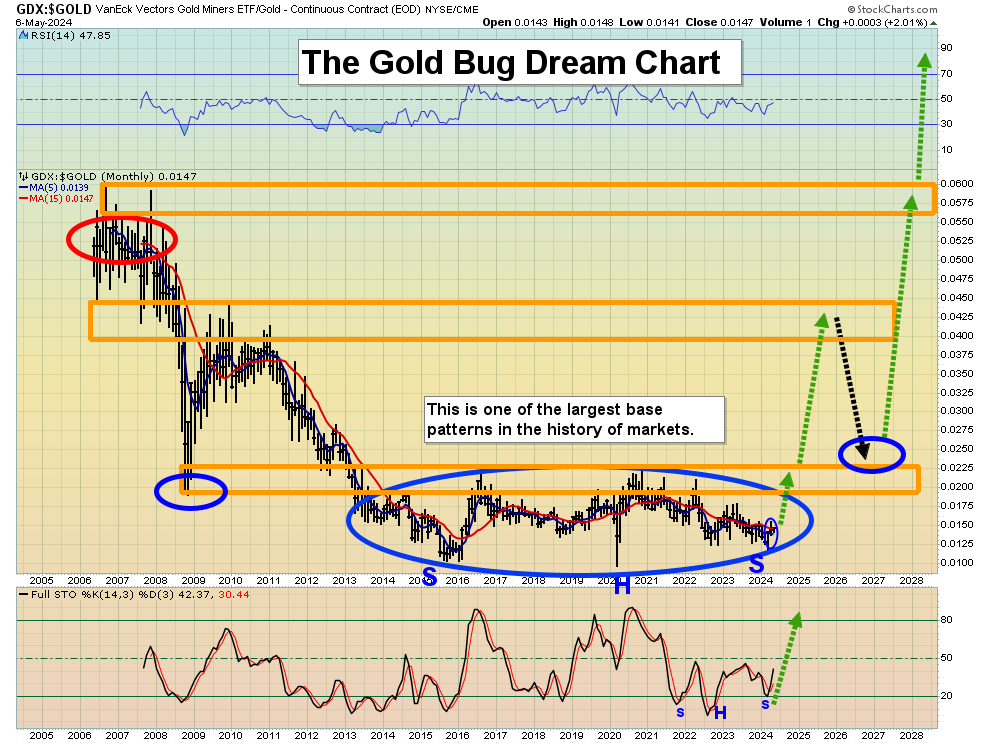
- As it relates to the gold and silver miners, the immortal words of Jim "Mr. Gold" Sinclair may soon be spoken by most of the world's money managers… and those words are, "We're compelled to buy!"
Thanks!