
Volatility continues to grip markets, and given the concentration of stocks in the latest bull market, we would expect no less. When you have an incredible run in a market fueled by seven stocks, once one domino falls, they all fall unless another takes its place. That is why monitoring the market breadth when trading stock indices is essential. Market breadth represents the total number of stocks that are increasing in price as opposed to the number of stocks that are declining in price. But how do you monitor volatility in a commodity such as Silver?
One straightforward way is to take the average true range (ATR) and multiply it by $/points. For the 1000-ounce Silver futures contract, every penny move is $10, while the ATR is 94 cents per day, meaning on an average day, one can expect to see a $940 fluctuation on average per day per contract. On Thursday, we saw a daily range of $1.53 or $1,530 per 1000 oz contract, which was an outlier. If you have read the Metals Edge since its inception last Monday, I have been warning that DMI - is attempting to cross above DMI +. Often, a negative crossover sets the stage for a larger correction."
The directional movement indicator (DMI) was created in 1978 by J. Welles Wilder and is a moving average of range expansion over a given period (the default is 14 days). The positive directional movement indicator (+DMI) measures how strongly the price moves upward; the negative directional movement indicator (-DMI) measures how strongly the price moves downward. The two lines reflect the respective strength of the bulls versus the bears. When the two cross, we often see an explosive uptick in volatility.
If you enjoy reading about strategies, insights, and in-depth analysis of Gold and Silver, the Metals Edge is a new Blue Line Futures product developed for Swing and Long-Term Traders. The daily report focuses on Gold and Silver and identifies trend changes, entry and exit points, seasonal tendencies, and option strategies. To register for a free two-week trial of the Metals Edge, you can do so here: Get Metals Edge.
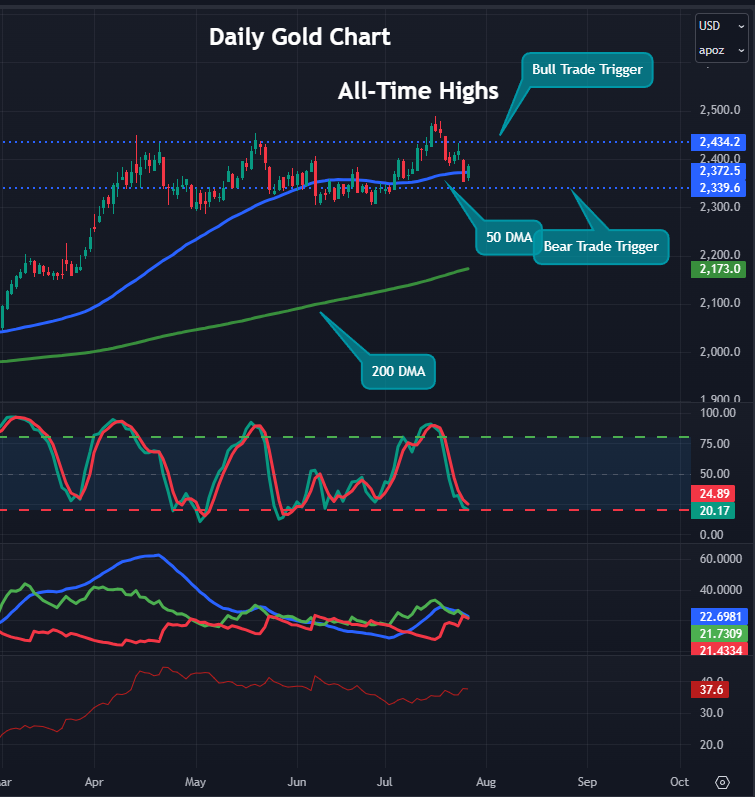
Daily Gold Chart
Technicals (August)
For Swing Traders
Bias: Neutral/Slightly Bullish
Resistance: 2400 (Psychological)**, 2434.2*** (Bull trade Trigger), 2448.4-2450.0***, 2488.4****
Pivot: 2375 (50 DMA)
Support: 2350-2345***, 2339.6*** (Bear trade Trigger)
The liquidation in Gold paused on Friday as traders digested the latest PCE inflation data. PCE is the last big data point before the Federal Reserve meets next week. I expect to see Jerome Powell pivot dovish on Wednesday and help cement a bottom on Gold.
If you get the metals edge, I mentioned several times this week that "If the bulls cannot defend 2400, futures will likely trade down to the 50 DMA at 2375," which proved correct. Yesterday, futures closed at 2353.5, below our Trend Neutralizer level, taking Gold to a "neutral" trend. With the snapback in futures +$28, Gold must close above the 50 DMA at 2376.7 to stage another attack on 2400. A move back above 2434.2 will shift markets to a Bullish trend, while a close below 2339.6 will take the market to a Bearish trend.
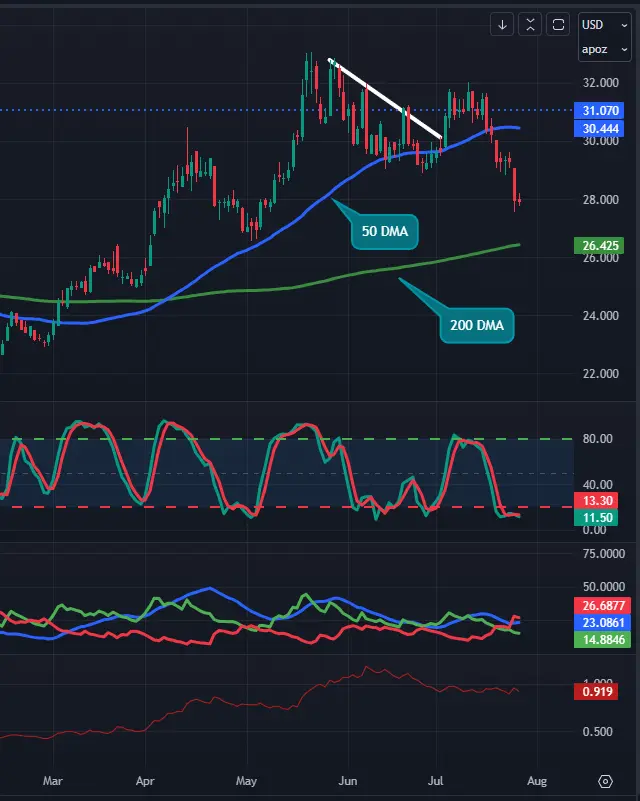
Daily Silver Chart
Technicals (September)
Resistance: 29.00-29.08**, 29.16**, 30.44*** (50 DMA),
Pivot: 29.08, 30.00
Support: 27.50**, 26.42**** (200 DMA)
Futures are trying to find footing after Thursday's $1.53 range and severe price breakdown. To attract buyers, we will need to stage a significant recovery or face a larger correction. My suspicion is that they will emerge near the 200 DMA at 26.42. If you haven't seen our daily "Metals Minute" video, where thousands of people tune in to get key levels and actionable trade ideas in Gold, Silver, Copper, Crude oil, and the S&P 500 every trading day. Register for a free two-week trial here: Get the Metals Minute.