Sep 3, 2024
- Is the Fed making another mistake? The next Fed meeting and interest rate decision is scheduled for September 18. Analysts in both the gold and mainstream investing communities feel that rate cuts should have already happened, and the central bank is “behind the curve”.
- In contrast, I’ll suggest that the Fed should be raising rates at this meeting, to aid elderly savers, battle structural inflation, and most importantly…
- To force the US government to drastically reduce its outrageous addiction to spending and debt.
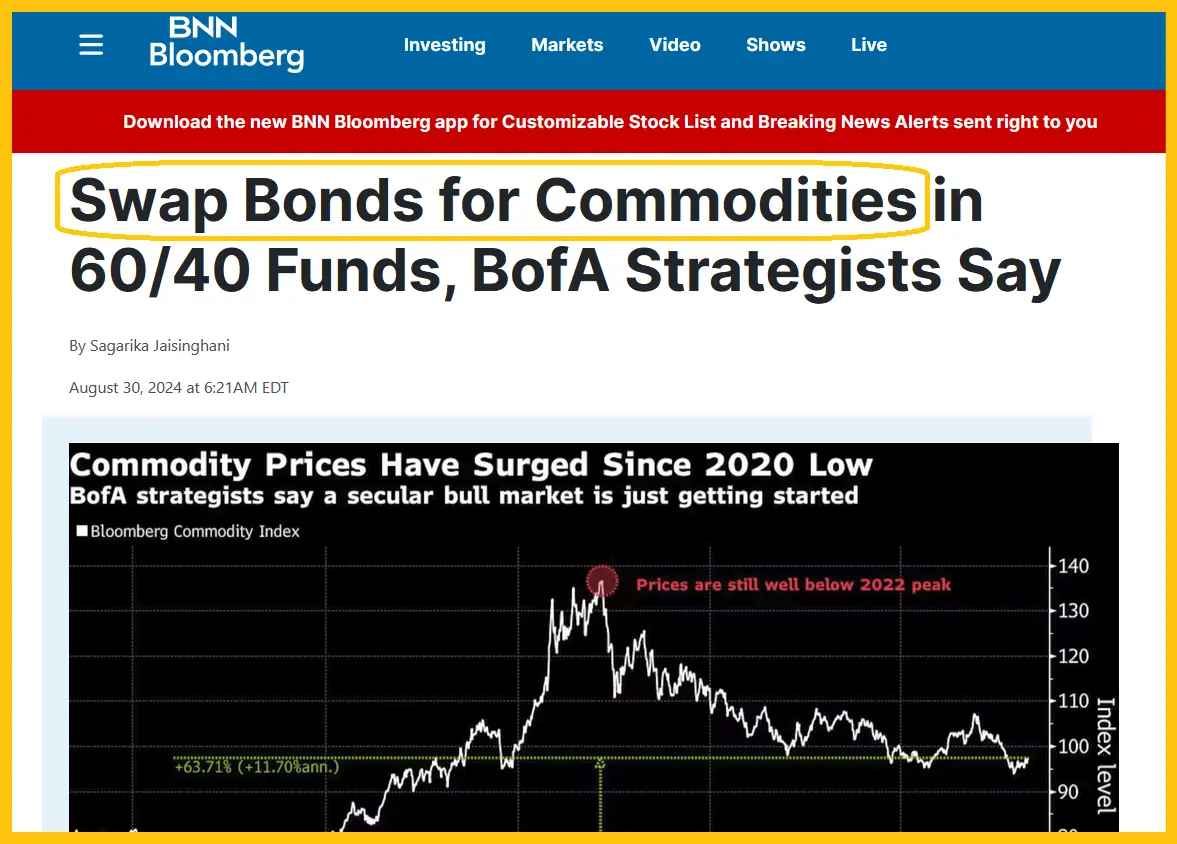
Double-click to enlarge. While Bank of America strategists don’t want rate hikes, they do see structural inflation coming into play, and that means higher commodity prices are here to stay.

For a more detailed look at their take on the situation. Is it possible that Fed chief Jay is joyfully announcing rate cuts… just in time for the next wave of inflation to start?

Double-click to enlarge. This PDBC commodities ETF appears to be basing. Note how similar the action is to oil, which is the largest component in most commodity indexes. A move above $15 for the PDBC would likely coincide with oil moving back above $100.

- This could happen just as the Fed goes on a rate cutting spree, triggering a huge new wave of inflation… and enraging most low and middle earners in America (who make up most of the population).
Double-click to enlarge. Here’s a look at key commodity copper. It may also be bottoming and doing it in my $4 buy zone.

For a look at an important US interest rates chart. Double-click to enlarge. A substantial head and shoulders top has formed, and the neckline is broken.

- A swoon down to 2.5% for rates would likely be accompanied with a big surge in commodity prices. It’s looking more and more like the Sep 18 Fed meet will be a major inflection point for a lot of markets.
Double-click to enlarge this interesting BDRY “shipflation” chart. Note the breakout from the bull wedge pattern that is now in play.

- The $10 price is a key round number and offers significant support. It looks like the correction that began in March could be ending.
For another look at it. Double-click to enlarge. A big inverse H&S bottom with a high right shoulder appears to be almost complete.
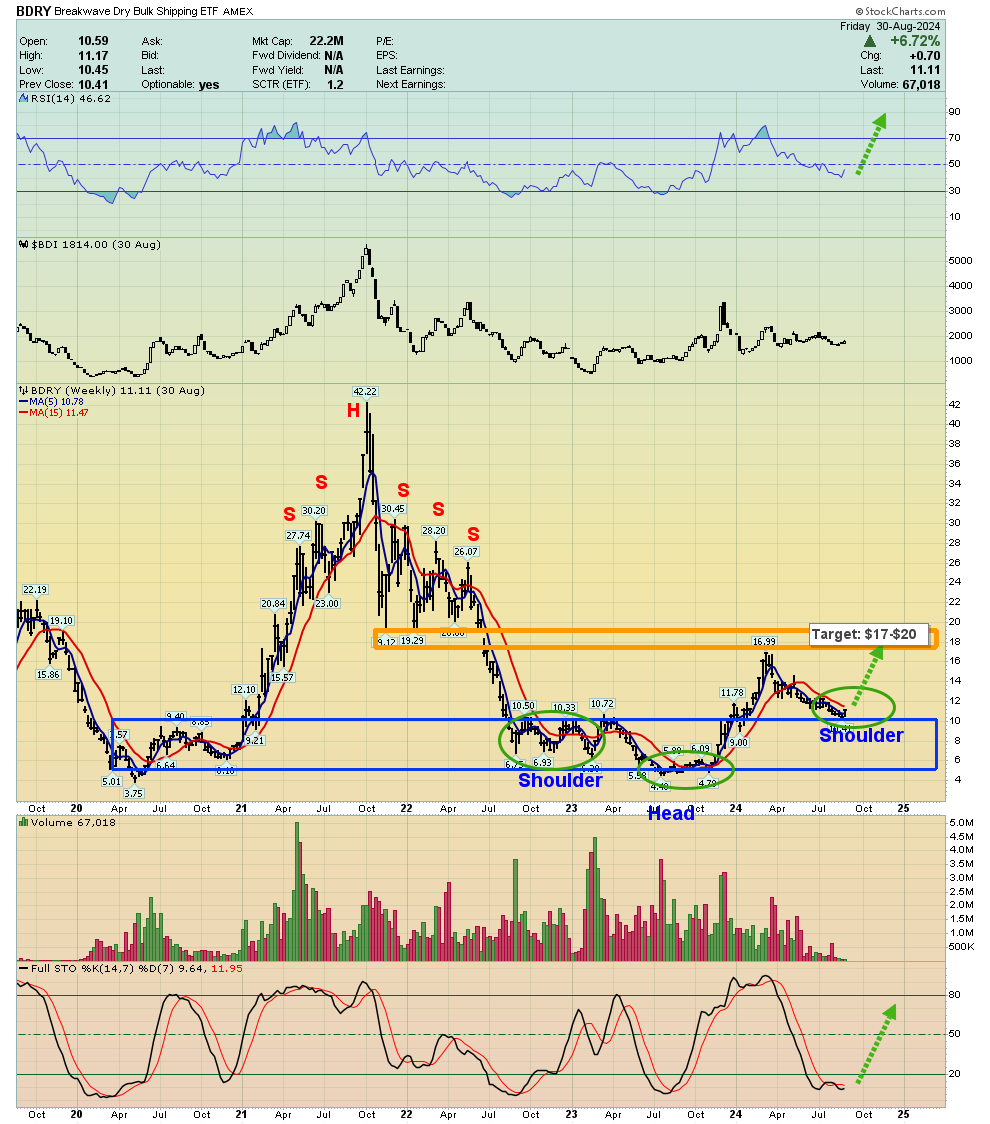
- The initial target zone of $17-$20 represents an almost 100% surge in shipping costs from the current level… and it could be argued that the base pattern will ultimately send the price towards $30.
- The bottom line: Rather than debating whether there will be a 25bp or 50bp rate cut, structural inflation and the horrifying government debt should be the focus of the endless parade of silly “Fed speakers”.
Double-click to enlarge this US stock market chart. The Dow Industrials have made a new intermediate trend high, but the Transports have not.

- That’s a modest concern, but it could become bigger if there’s no new high soon.
- I’ve mentioned September 18 as a possible major inflection point. Investors should be open to a US stock market peak and general commodities trough occurring at or around that date.
What about gold? Double-click to enlarge this weekly chart. While gold is vulnerable to a small “all the good rate news is in” swoon around September 18, it is the world’s greatest asset and currency.
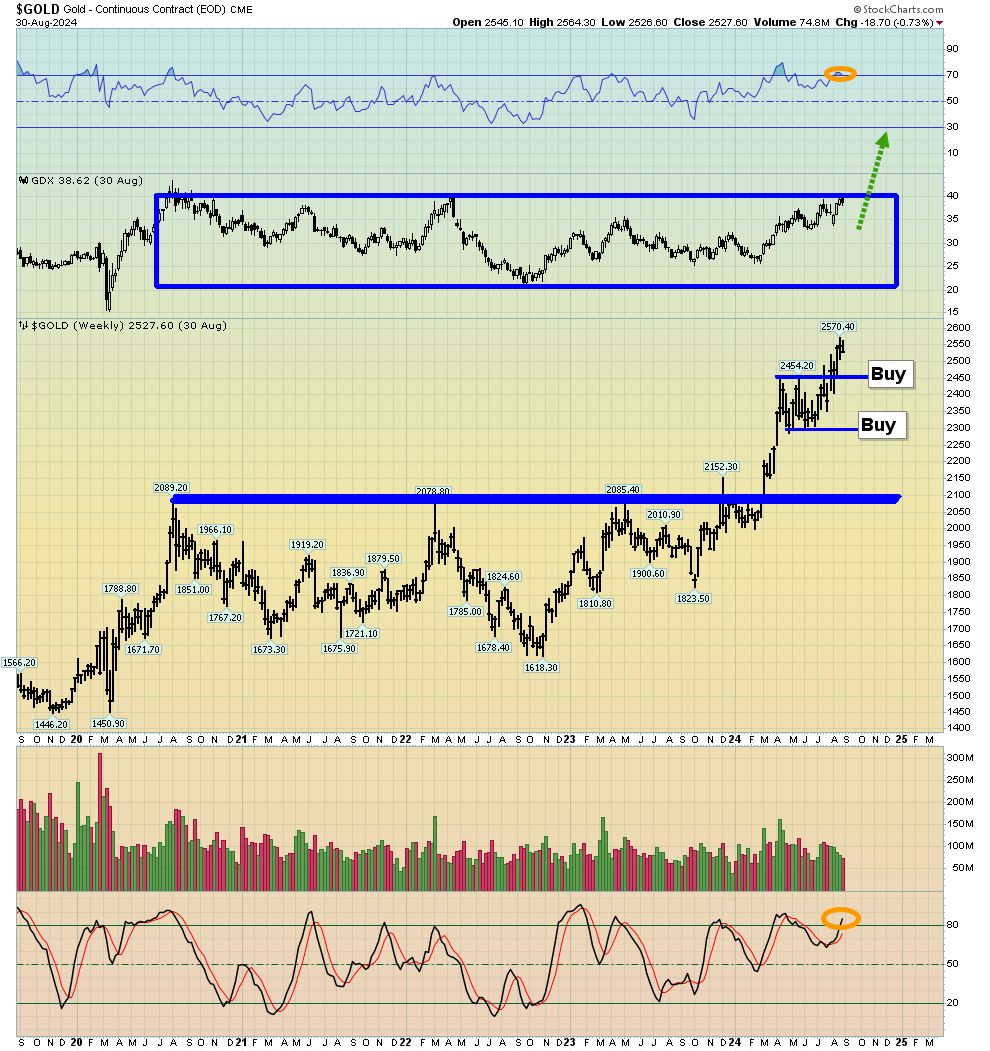
- So, the focus should always be on the price zones to buy more. On this futures chart, the $2450 and $2300 areas are where investors can take some action. Investors can consider a rough mix of 50% gold, 25% silver, and 25% mining stocks to buy on a dip.
- Each investor should make sure their allocation fits with their personal investing style and character, rather than just buying whatever seemingly offers the biggest gain.
For a look at the miners. Double-click to enlarge this GDX daily chart. There’s a small bull wedge in play, and it fits with my scenario of a big rally going into the September 18 Fed announcement.
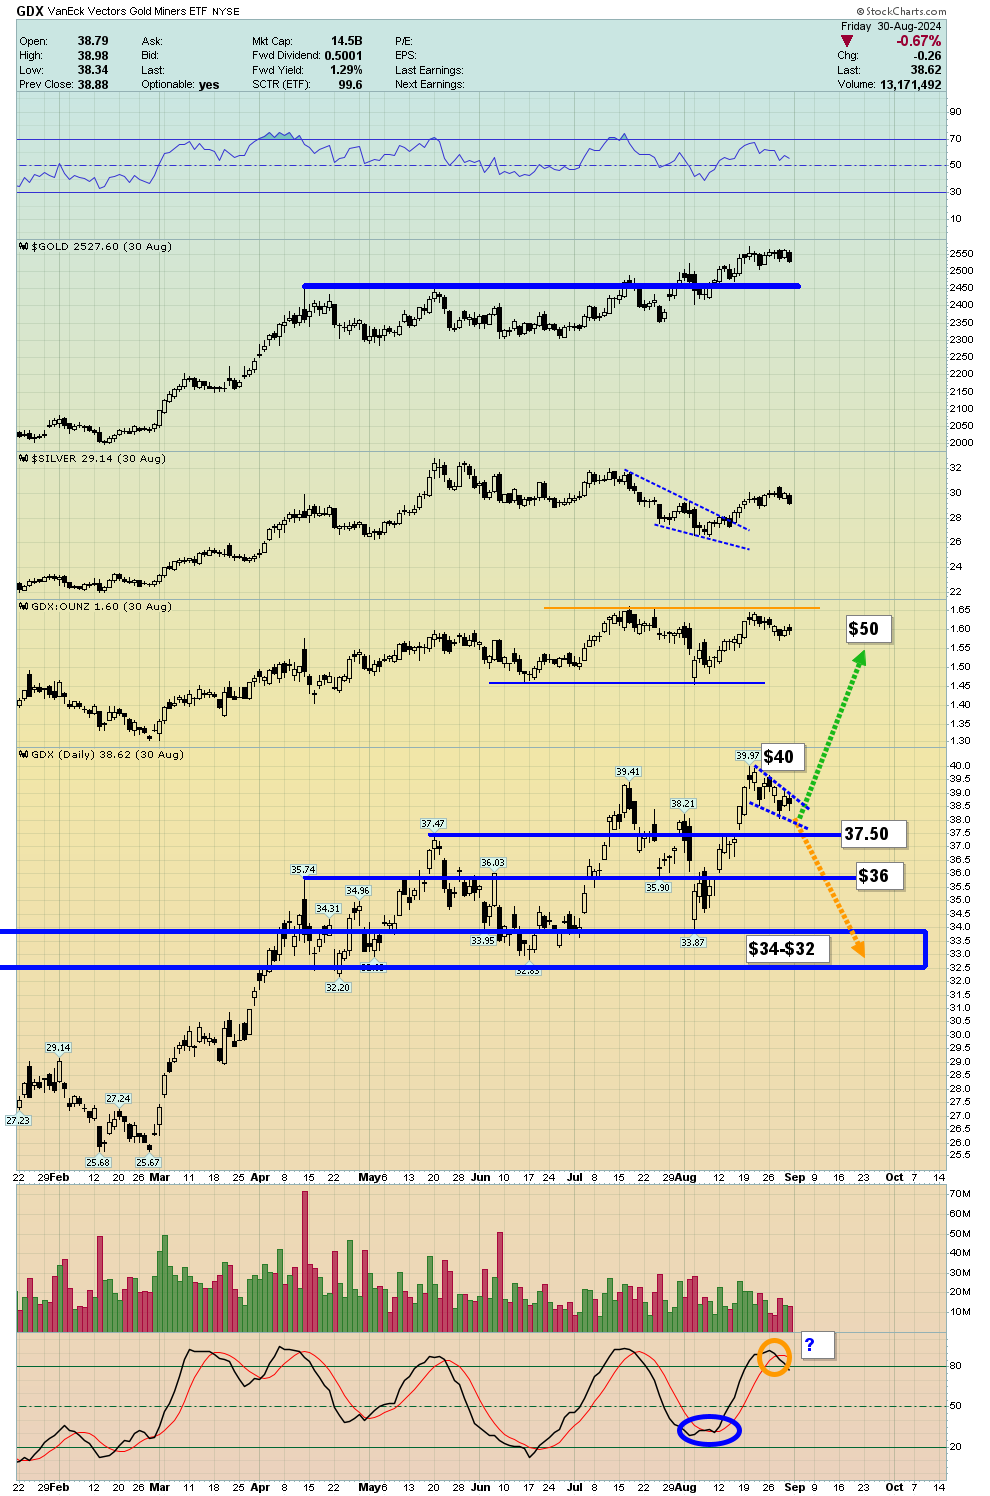
- GDX could make it to $43 or even $50 before the inevitable pullback begins, and gold could be at $2600+. Investors can focus on $36 and $34-$32 for GDX as support zones that may correlate with $2450 gold.
- Structural US inflation is poised to make the 2020’s for commodities look like the roaring 1920s for the stock market, and the start of the fun could be only 2 weeks away!
Thanks!