
So, the GDXJ plunged about 5% yesterday, and it refused to get back up, even though gold price did.
Continuation of GDXJ Decline Likely
What a demonstration of weakness!


After the vertical plunge, the GDXJ simply paused. This simply confirms what I wrote previously – that this is NOT the end of the decline, it's just an acceleration in it.
My yesterday's comments on the likely head-and-shoulders top formation in the GDXJ remain up-to-date:
Since the GDXJ didn't move above its July high, but rather topped slightly above its May high, (and given that the next big decline is likely just around the corner) it seems that we're seeing a head-and-shoulders pattern, with the May and August tops being shoulders and the July high being the head of the patterns.
The downside targets based on this formation are created by copying the height of the head and pasting it below the neck level, which I've done using red, dashed lines. This technique points to the target at about $33. We'll know more when the GDXJ breaks below the neck level and it's closer to this target – based on where gold, stocks, and the USD Index are. For now, however, its seems quite possible that the GDXJ will slide there before rebounding (and not from $34). The $34 level is more conservative, so I'm still basing my target on it (the first GDXJ chart from today's analysis still supports it), so we'll probably end up taking profits at about $34, anyway, but I wanted to share this bearish confirmation with you either way.

Gold corrected most of its intraday decline during yesterday's session, but that's not really important. The important thing is that was the third daily close below the lower border of gold's rising wedge pattern, which means that the breakdown is now fully confirmed.
This means that MORE declines are more likely on the way. In fact, we already see them in today's pre-market trading.
And this shouldn't come as a surprise to you, given that you were prepared in advance for gold's slide after the U.S. Labor Day.
Also, please note that spot gold just verified its move back below $2,500 by moving back to this level and then declining again.

Silver Fails to Hold Above $30
Meanwhile, silver is also declining.

The white metal once again failed to hold above the $30 level and it declined in the immediate aftermath.
While the short-term outlook for the silver price is bearish in my view, let's not forget that silver has great long-term potential. Some may view the near-term declines as an opportunity to short the silver market (I continue to prefer shorting junior mining stocks over silver, also due to what's happening in the GDXJ:silver ratio), while some may view it as something that brings one a great buying opportunity.
Speaking of the GDXJ to silver (SLV) ratio, here it is.

The RSI based on the ratio was just very overbought as measured by the RSI indicator, and while it's no longer overbought in this way, it hasn't really declined yet.
This is similar to what we saw in early 2023 – the RSI was close to 70, then it declined but the ratio continued to trade sideways. What happened next?
The ratio declined, meaning that junior miners declined more than silver. In other words, to was better to be shorting GDXJ than SLV. If one was shorting GDXJ and was long silver at the same time, they would make money (assuming similar exposure to both markets).
All right, I know what you're thinking – the title mentioned crude oil, and I haven't even touch on that market yet. Let's catch up.

The reason that I'm featuring crude oil today (even though we have a completely separate service dedicated to this market) is that:
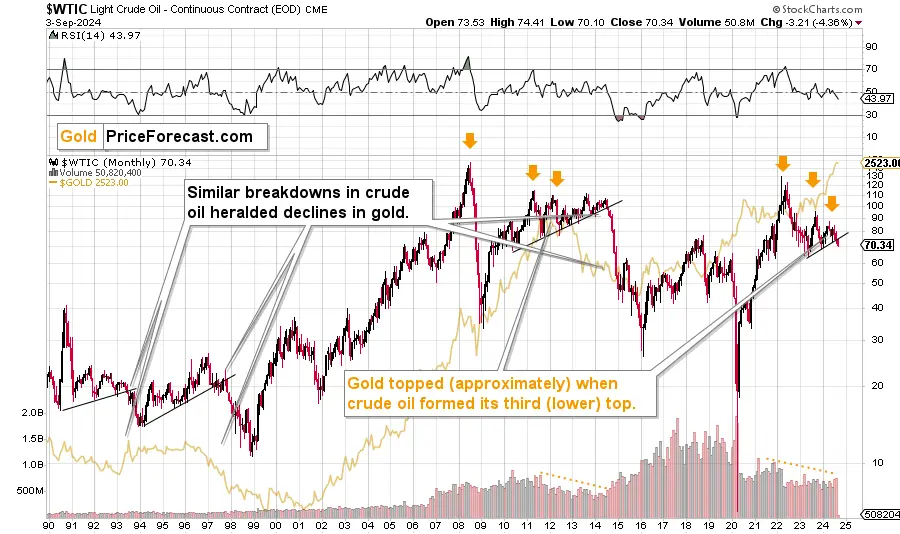
1. We have a major breakdown in crude oil (as you can see on the above weekly chart)
2. Whenever we saw a similar breakdown in crude oil (in the past 34 years), something similar happened in gold (as you can see below).

Since 1990, there were three similar cases, when black gold's price moved below its rising, medium-term support lines:
• in 1993
• in 1997
• in 2014
As you may have guessed, crude oil declined in a significant way in each case. In particular, the decline that followed in 2014 was huge.
However, from our – precious metals investors' and traders' – point of view, something else is much more interesting.
The thing is that in all those three cases, it was not only crude oil price that fell – gold price fell as well.
In 1993, gold topped and then declined.
In 1997, gold's decline simply continued.
In 2014, gold's decline continued.
The fact that it's just three cases might make this analogy seem irrelevant, however, I would like to emphasize that between 1990 and now gold has been in an uptrend in most of the years. Consequently, sell signals are much more difficult to get than buy signals.
I mean that if you randomly pick some dates, the odds are that gold would be rallying after those days. That's why you also have so many analysts that appear successful while only saying "gold will go up" over and over again… Making money on both: rallies and declines might indicate skill, but if one is a perma-bull, those successes don't really show it.
Getting back to crude oil, seeing three bearish confirmations and no bullish ones is an important indication. I wouldn't say it's safe to trade based just on it, but it's not the only factor that we're considering here – there's many of them, and this simply confirms the other ones.
One more thing. I marked a similar triple-top pattern in crude oil with orange arrows – the first top was particularly notable – it caused RSI to move above 70, which we also saw right now. These were lower highs in both cases, and gold continue to move up through those highs in crude oil… Until it topped close to the third top in crude oil.
As we recently saw the third top in crude oil, we have a confirmation that the final top in gold (for a longer time) is in.
The biggest trading opportunity here is not in gold, though, but in junior mining stocks. I know that I wrote it so many times in the recent months, but this simply remains to be the case, and I don't want anyone to think that (in my view) this opportunity is gone or over – it's still here, and those, who are strong and patient, are likely to be very well rewarded.