
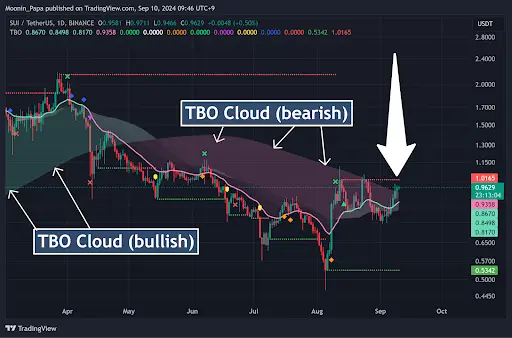
As we dive into the latest movements on the $SUI chart, several key indicators are suggesting that this heavily oversold asset could be preparing for a bullish turnaround. After experiencing a significant drop of more than 50% from its high of $2.18 in April 2024, $SUI is catching the attention of traders once again, with increasing excitement about its potential to recover and even surpass its all-time high.
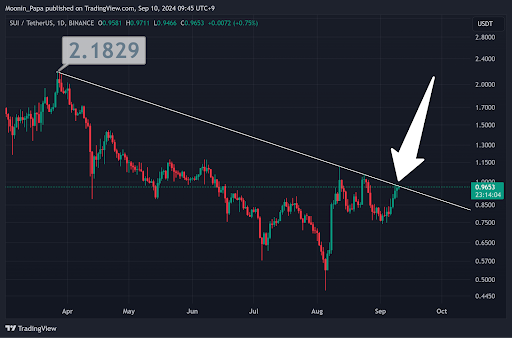
A Look at the Recent Price Action
Currently, $SUI is testing a critical level of overhead resistance, marked by a white diagonal line on the chart. This level has been tested twice in recent weeks, with the first rejection occurring on August 24th. However, during the latest test on September 8th, instead of facing another sharp rejection, the price has been "hugging" the resistance line—often a sign that a breakout above this level could be imminent. A clean break above this diagonal resistance could pave the way for higher prices in the coming weeks.
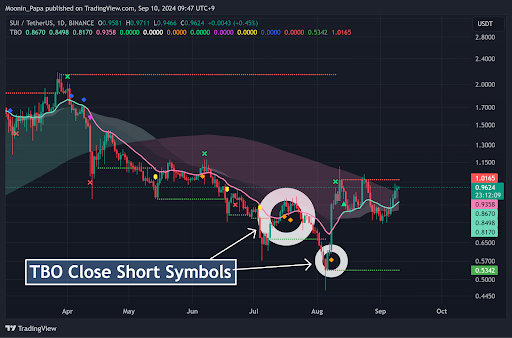
TBO Indicator: Signaling a Trend Shift
The TBO Indicator (Trending Breakout) is another critical tool in assessing $SUI’s potential. Despite several sharp sell-offs, the chart has printed multiple TBO Close Short signals (marked by orange diamonds ? below the price). These signals are often early indicators of an upcoming trend reversal, suggesting that the extended bearish trend might be coming to an end soon.
For those with open short positions, these TBO Close Short signals could be a nudge to consider taking profits, as the chart shows signs of shifting to a bullish sentiment. These early "trend change" alerts serve as warnings that the current bearish momentum may no longer have as much steam, opening the door for a potential price rally.
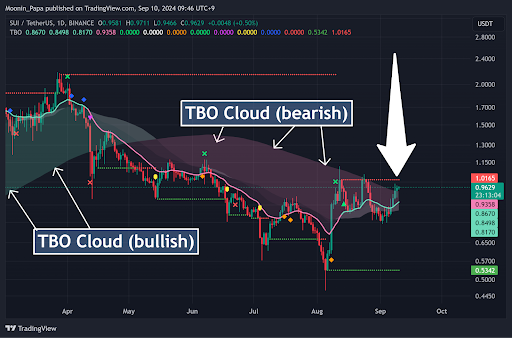
Understanding the TBO Cloud
The TBO Indicator also provides additional context with its "cloud" feature, where green clouds indicate strong bullish trends and red clouds signify strong bearish trends. The red TBO Cloud, which sits above the price, has been a dominant feature on the chart since mid-May, representing the bearish consolidation that has weighed on $SUI. However, for the first time since April 2nd, the price has managed to close above this daily red cloud.
Closing above the TBO Cloud marks a significant moment in the trend—this often signals a transition into bullish consolidation. While this process typically takes time and might involve some sideways movement before breaking out strongly, it is nonetheless an encouraging sign that $SUI may be gearing up for a stronger move upward in the near future.
Price Projections for $SUI
With these technical indicators aligning, I believe that $SUI could be setting up for a bullish reversal, potentially targeting the $1.80 range in the coming weeks. However, based on the current market conditions and price structure, it’s unlikely that $SUI will meet or exceed its all-time high of $2.18 before January or February of 2025.
Final Thoughts
Traders and investors should keep a close eye on $SUI in the coming days, particularly if it can break through the overhead resistance it is currently testing. The TBO Indicator is flashing signs of a trend change, and the price's movement above the daily TBO Cloud is a strong signal of potential bullish consolidation. While it might not be an immediate rocket to new highs, the groundwork is being laid for a significant price movement that could develop in the final quarter of 2024 and early 2025.
As always, it’s essential to approach the market with caution and remember that past performance does not guarantee future results. But for now, the outlook for $SUI looks more optimistic than it has in months, with traders gearing up for what could be a substantial reversal in the making
