Sep 24, 2024
- Some Asian money managers are raising their recommended allocation to gold from 15%-20% to 25%.
That’s good news, and for a look at some more important Asian gold-related news. Reserve ratio cuts are a form of money printing, and money printing sets off “buy more gold” alarm bells for the citizens of China and India.

Online purchases of gold from companies like Amazon are taking off in India, and this demand could become a tidal wave in the coming years.

Double-click to enlarge this big picture chart of US fiat versus gold.

- Because gold is the world’s greatest currency, all gold bugs should consider setting a personal threshold… a minimum percentage of their net worth to hold in gold.
- Nothing rises or falls in a straight line forever, and the dollar and gold are not exceptions to this rule. As gold edges closer to the key $3000 mark, a “pullback of significance” ($100-$200) becomes more and more likely.
- The good news is that the pullback will give investors with meagre amounts of gold a chance to add to their holdings.
Double-click to enlarge this daily DXY (US dollar index) chart. Both RSI and Stochastics are showing positive divergences with the price… and doing it at the key round number zone of 100.

- The dollar is likely to fall significantly under 100 in the coming year, but perhaps not before one final move up occurs. Friday brings the PCE inflation report, which is Fed chief Jay’s favourite metric for measuring price action in the economy.
- That PCE report could bring significant volatility to markets… and possibly mark a short-term peak for gold.
Double-click to enlarge this US stock market “chart of concern”. The Transports continue to fail to confirm the relentless rally in the Industrials.

The Industrials show a worrying loss of relative strength with each major new high.

- What is clear is that the stock market is nowhere near a buy zone of significance; RSI and Stochastics on this monthly chart should both be down to the 50 area (or lower) before the market can be said to offer value for investors.
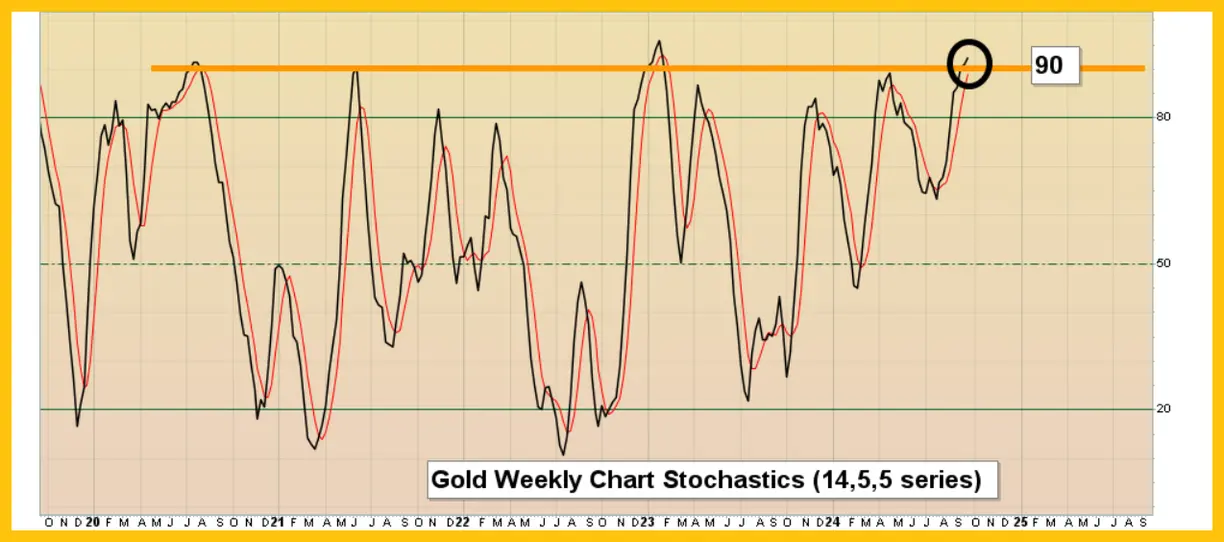
The bull flag and inverse H&S action on this weekly close chart suggest gold could run to $2800, $3000, or even as high as $3300 before there’s a pullback of significance.

Having said that, please. Double-click to enlarge. Here’s a snapshot of the key weekly chart Stochastics oscillator (14,5,5 series) for gold. It’s rare for it to hold above 90 for very long… and above 90 is where it is now.

- The last major buy zone for gold was in October of 2023. That’s almost a year ago, and gold is up 40%+ against US fiat since then. Clearly, a pause or pullback of significance can be expected to occur soon.
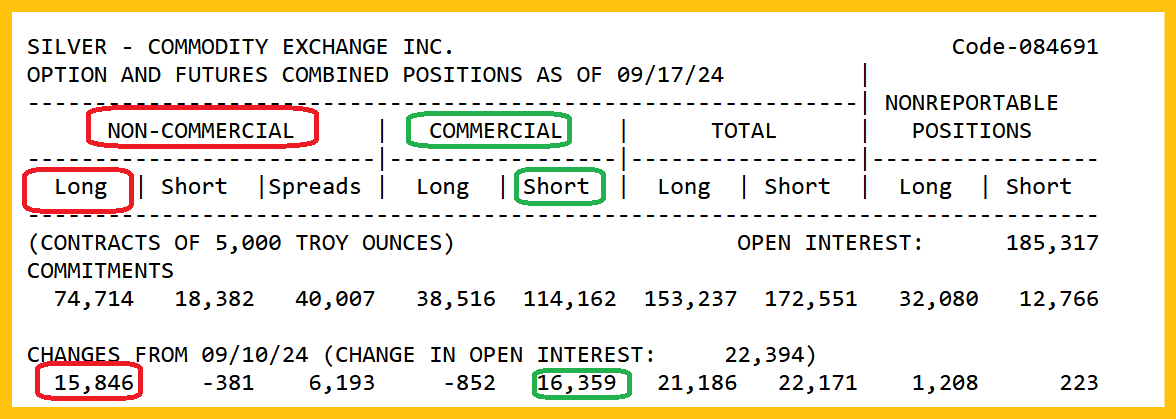
For a look at silver, please Double-click to enlarge.

The chart is incredibly bullish. The smart money commercial traders are adding a lot of short positions while the dumb money funds pile on longs.
Double-click to enlarge. The good news about a pullback of significance for gold and silver is that it’s likely to be accompanied (somewhat ironically) with a “rally of significance” for key commodities like oil, wheat, and copper!
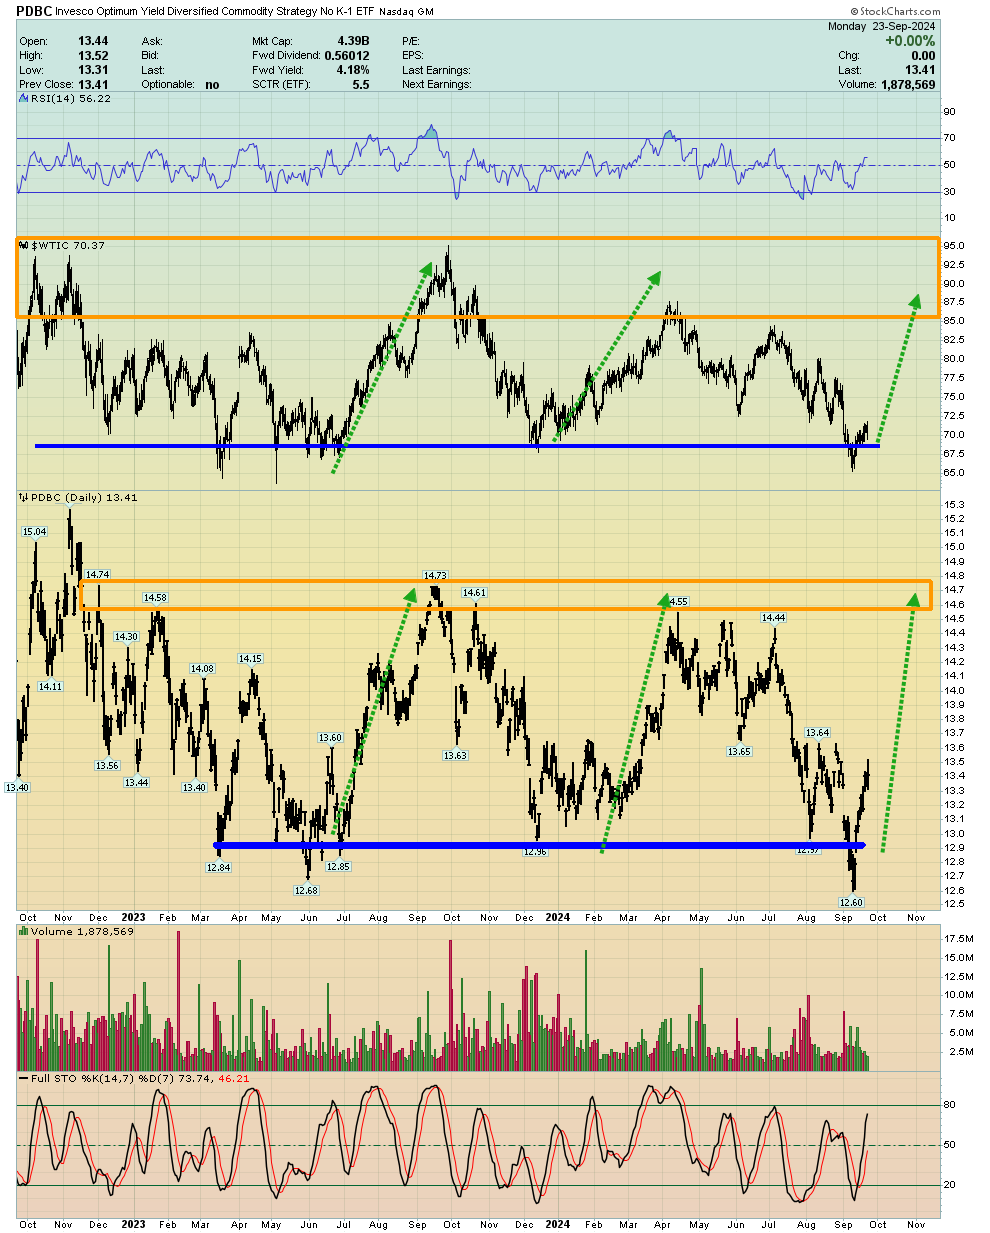
- This PDBC general commodities ETF (with no K1 form required from investors) chart looks good. The price is bouncing from key support, and oil is too.
- ETFs like COPX (copper stocks) and XLE (oil stocks) could fare quite well in the coming months.
- What about the miners… what will they look like during a gold and silver price pullback of significance?
Double-click to enlarge this weekly GDX chart. The current rally has stalled at $40, but a final push to $43 could occur. The key investor buy zones are $38 (gamblers), $36 (aggressive investors), and $33 (conservative investors). Ideally, a dip to $33 would be accompanied with a $100-$200 dip in the price of gold.

Regardless. Double-click to enlarge this big picture chart of GDX versus gold. Basis Elliott Wave analysis, gold is in a “C wave”, which typically is the wave with the greatest amount of price action… action that occurs in a very short amount of time. The surge from the October 2023 lows has all the hallmarks of a C wave.

- It’s highly unlikely that the coming pullback marks the end of wave C, and instead… the move that follows is likely to be the most powerful gold stocks rally of the past fifteen years!