1 October 2024
During the 2008 Great Financial Crisis (GFC), the monetary system faced a significant challenge. In a gigantic effort to contain the financial crisis, large amounts of U.S. dollars were created by increasing the monetary base.
They were able to avoid collapse, but the underlying problem (an extremely debased currency) obviously did not go away simply because the solution further debased the currency.
There was a general lack of liquidity in the system since the velocity of the money supply was dropping off a cliff (debts were too high to support the level of currency in the system). Refer to my blog for more insight.
The increase in the monetary base eventually solved the liquidity problem, but at the cost of debasing the currency to unprecedented levels.
By March 2020, the monetary system was again facing a crisis (but with another name). Again, large amounts of U.S. dollars were created to deal with the problem.
Again, the velocity of the money supply was dropping off a cliff, and again, a massive increase in the monetary base was the remedy.
The financial system is still standing, but for how long? Is the remedy of more dollars having the same effect as during the GFC, or is something else happening?
Here is a chart of the U.S. dollar gold price relative to the U.S. monetary base:
The chart shows the ratio of the gold price to the St. Louis adjusted monetary base. That is the gold price in US dollars divided by the St. Louis ddjusted monetary base in billions of U.S. dollars.
This ratio can be interpreted as a measure of how debased the currency is. Point 8 on the chart is the lowest since the existence of the Fed, and therefore the most debased the currency has ever been.
When the ratio rises, confidence shifts to gold rather than the U.S. dollar. In the late 1970s to early 1980s, this ratio was as high as 5 during a parabolic spike. It took a massive increase in interest rates to bring confidence back to the U.S. dollar (monetary system).
A parabolic rise of this ratio can also be interpreted as a bank run on the U.S. financial system, as explained in my two-part article, Gold and System Collapse: Charting the Bank Run of the Mighty US Dollar.
During the GFC, the ratio of the chart dropped significantly to point 2 when the monetary base was increased. This was almost back at the same level as the start of the gold bull market in 2001. It was only in December 2008 that the gold price rose sufficiently to move the ratio higher again.
During the 2020 crisis, the ratio also dropped significantly to point 2 when the monetary base was increased. Again, this was almost the level it was at the start of the gold bull market in 2015.
Both patterns kept a similar form from point 2 to 6, during the ratio's slow march higher. However, it was after point 6 that a significant deviation happened.
During the GFC, the ratio failed at point 7, unable to go higher than points 3 and 5, and eventually making a new all-time low. The U.S. dollar was at its most debased, but confidence in the system was still kept. In other words the gold price was still contained.
The 2020 crisis is following a different path that diverged from the GFC pattern during 2024, when gold made that significant breakout in March. Gold is not being contained, and faith and confidence in the U.S. dollar monetary system are failing fast.
A breakout at the gold-coloured line will be a significant confirmation of this trend (confidence shifting from the US dollar to gold). At some point this will feel like a bank run on all levels.
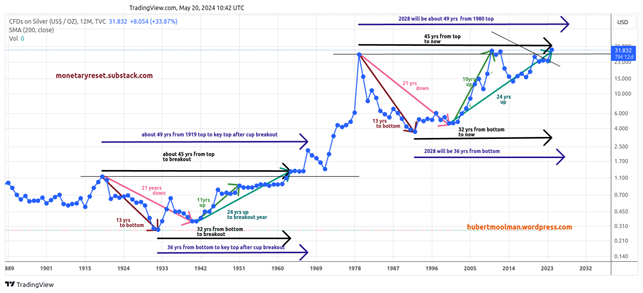
Keep up with gold and this silver chart below by joining my premium blog.
Warm regards
And that, knowing the time, that now it is high time to awake out of sleep: for now is our salvation nearer than when we believed.