
For technical analysts, the end of September means fresh monthly and quarterly charts.
Our entire world is focused on the short term at the expense of the long term. As such, monthly and quarterly charts are rare.
However, they are very important as they beautifully illustrate long-term trends.
Sometimes, they provide us with a hint of the future.
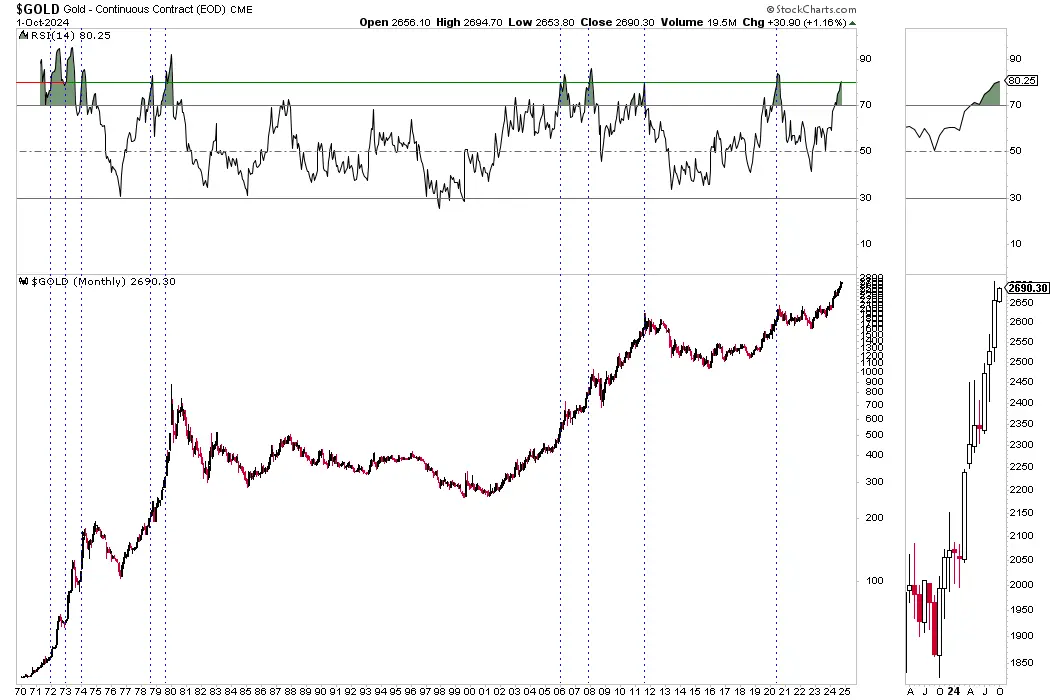
Gold made a new monthly all-time high in November 2024 and a new quarterly high at the end of 2024. Both events signaled the breakout to come a few months later.
At present, the monthly chart remains very strong for Gold but is getting overbought.
The last three candles all closed near the month's highs, indicating strength. Gold has a bit more room to run before its measured upside target of $3000.
The RSI, a momentum indicator, is overbought but not yet at a true extreme. The vertical lines mark similar overbought readings. The majority do not correspond to market tops.
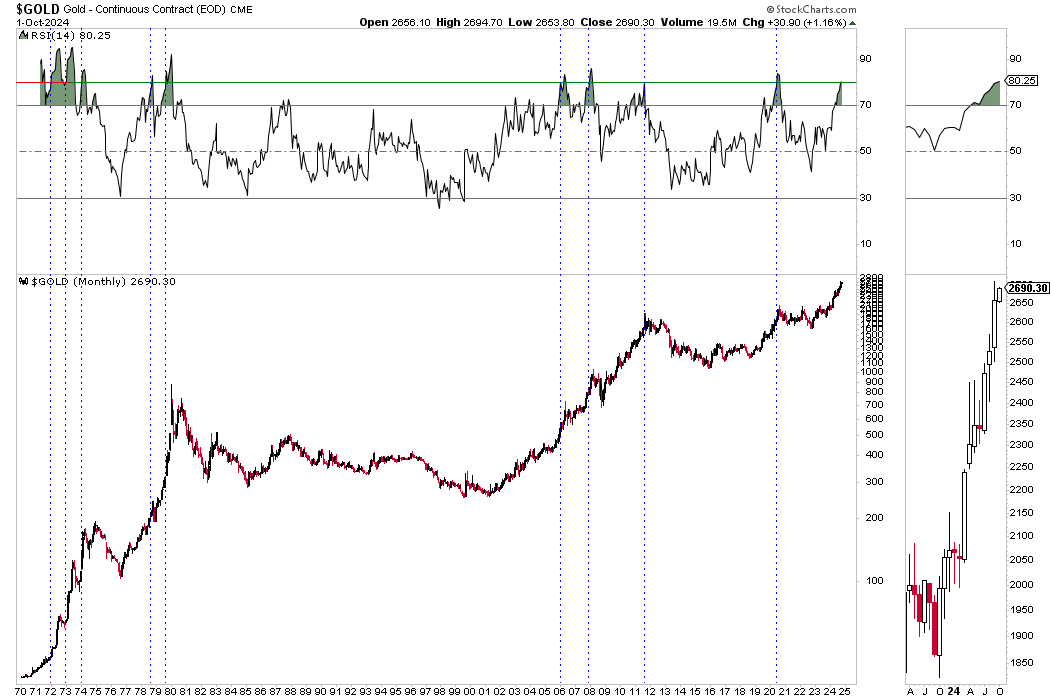
The quarterly chart for Gold shows similar quarterly momentum in early 1972, mid-1978, and late 2005.
Silver is more interesting as, unlike Gold, it is not close to its all-time highs.
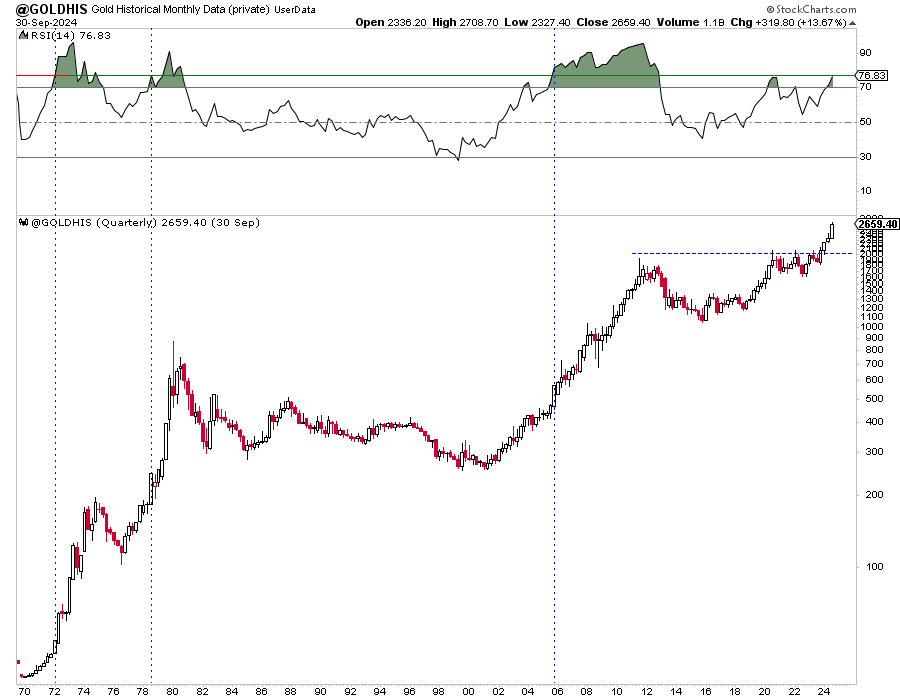
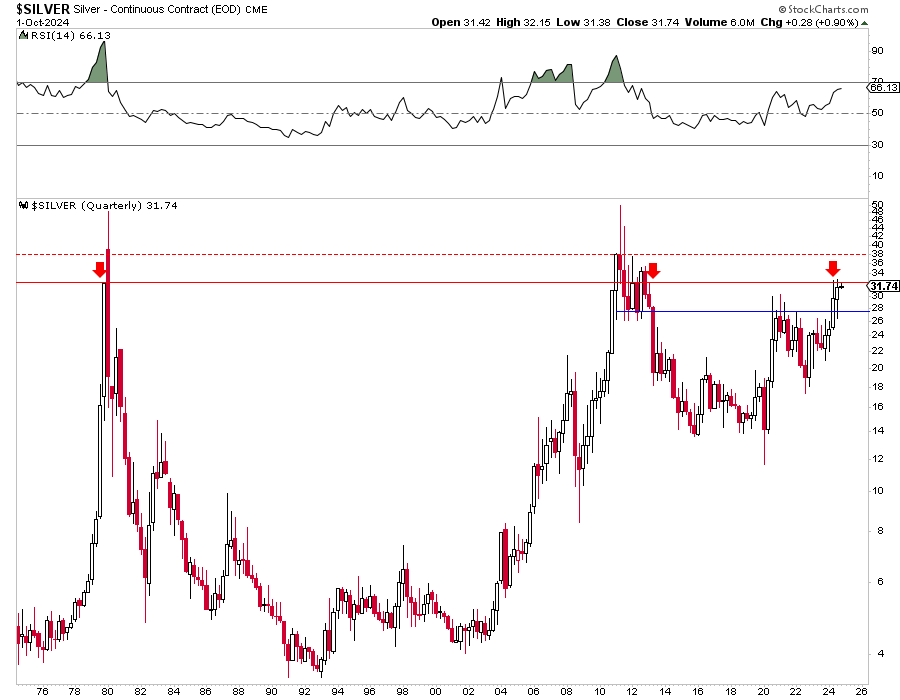
September was an important month for Silver because, after three months of retesting the peaks of 2020 to 2021, it gained 8% and closed at an 11-year high.
The monthly chart shows support at $28-$29 and significant resistance at $35, dating back to the peak in 1980.
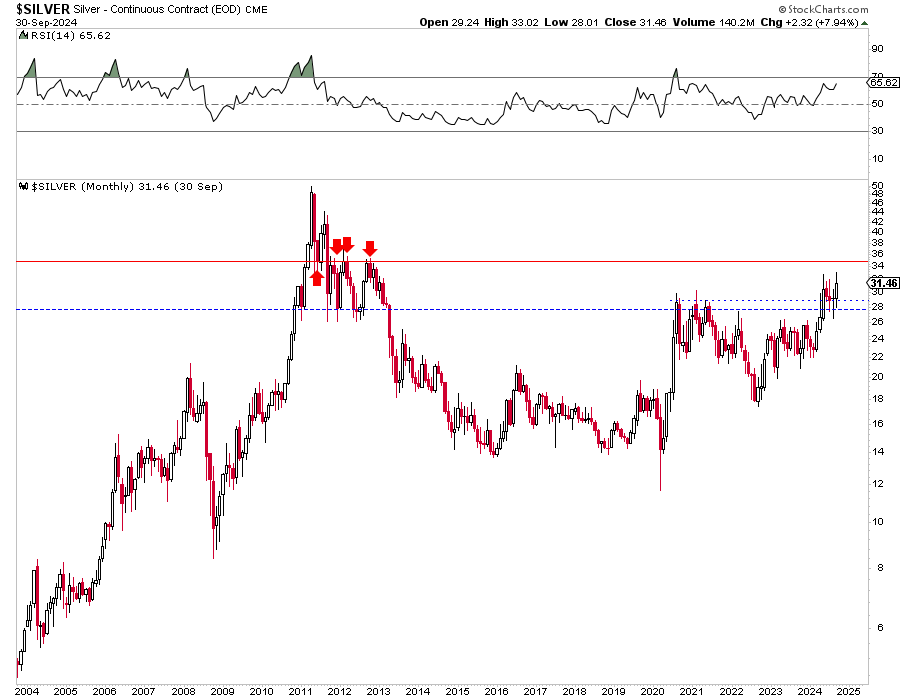
The quarterly chart for Silver shows $32 as resistance, which Silver has tested in each of the past two quarters. The next resistance is $38, but $32 is more significant, as it also marks the yearly all-time closing high.
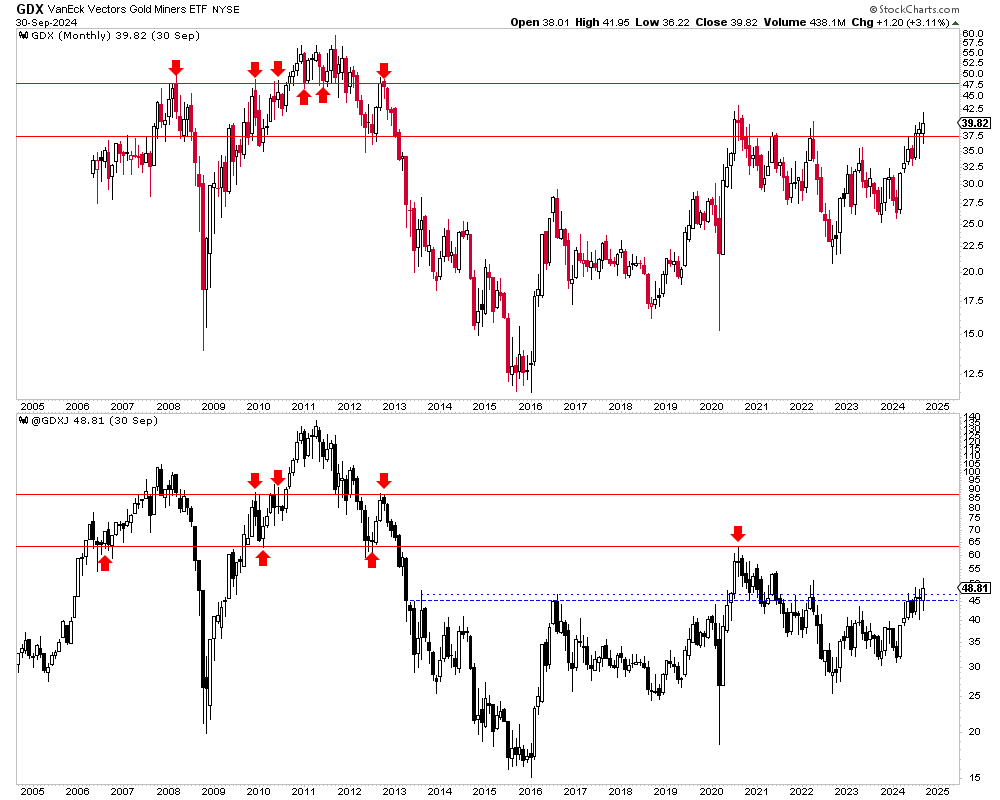
Finally, we show the monthly charts of GDX and GDXJ in the image below.
GDX closed September at a 4-year high and confirmed August's breakout above $37.50, which has been significant resistance since 2021 and an important level from 2006 to 2012. The next upside target is $47.50.
GDXJ closed September at its highest monthly close in over three years. It surpassed $45-$46, an important level since 2013. It faces some resistance at $54-$55, while the next major resistance is $60.
Quarterly and monthly charts are an excellent way to simplify the analysis of trends and evaluate the big picture.
Gold remains in blue sky territory but is fairly overbought. At $3000, it could be due for a correction or rest.
Silver is intriguing as it now faces significant resistance at $32 and $35. It could certainly trade up to $36 or $37, but how long it takes to clear $35 with a monthly close will go a long way in determining the timing of a move to $50.
The miners, meanwhile, have just broken out on the monthly chart. If Gold and Silver are headed to $3000 and $35, they will trend higher.
High-quality juniors remain a very good value and will continue outperforming GDX and GDXJ.
To learn the stocks we own and intend to buy with at least 5x potential over the next 18 to 24 months, consider learning more about our premium service.
