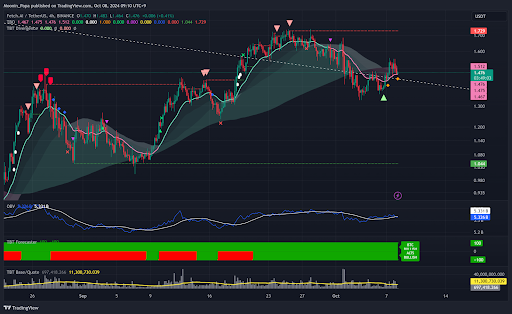
Bitcoin’s recent price action has been a mix of optimism and rejection, with the cryptocurrency encountering strong resistance at $64,400. Despite earlier bullish momentum on the 4-hour chart, Bitcoin’s latest daily candle is not looking favorable, and it’s a reminder of the volatility that can appear suddenly in crypto markets. As we navigate this phase of consolidation, there are key levels and indicators to watch closely.
Rejection at $64,400: The 1.618 Support Level in Focus
Bitcoin’s upward momentum has hit a significant barrier at $64,400, a level that has been difficult to overcome. While the 1.618 Fibonacci support level has been pierced and closed below several times, it remains a logical next step for support in the near term. However, it’s important to watch how price action develops around this area to determine if it will hold or if further downside is ahead.
A concerning development is the behavior of On-Balance Volume (OBV). OBV recently crossed below its white moving average, indicating that cumulative volume—and by extension, market interest and confidence—are on the decline. While the moving average is still trending upwards, the question remains whether this upward movement will be strong enough to pull Bitcoin’s price back up. Right now, it seems unlikely that this will be enough on its own to sustain a recovery.
RSI Resetting: A Repeating Pattern?
One of the more optimistic signals comes from the Relative Strength Index (RSI), which is showing signs of repetition from earlier price resets. By comparing the RSI patterns from late August to September with what we’re seeing now, there is a potential for a similar reset that could help propel Bitcoin back toward recent highs. However, this is still in the early stages, and any bullish momentum would need confirmation from additional indicators.
On the weekly timeframe, Bitcoin is holding steady as long as it stays above the weekly TBO Cloud, a critical level for maintaining bullish momentum. The current price action shows an upper wick that could act as a "predictive wick," signaling that the market might push Bitcoin up to meet or exceed recent local highs. But for now, it’s a waiting game.
Bitcoin Dominance and OTHERS.D: Altcoins Are Still the Focus
Bitcoin Dominance (BTC.D) has remained relatively "chill," signaling that the broader market is still more interested in altcoins and smaller projects. This is further evidenced by the recent push from OTHERS.D, the dominance chart tracking altcoins, which is attempting to break out of the daily TBO Cloud. If OTHERS.D succeeds in breaking out, it could mean more bullish momentum for altcoins in the coming days.
At the same time, stablecoin dominance has fallen back into the daily TBO Cloud, a sign of bearish consolidation. This is actually a good thing for crypto markets, as a decrease in stablecoin dominance often indicates that traders are moving money out of stablecoins and back into Bitcoin and altcoins, potentially fueling the next leg up.
DXY and Traditional Markets: Volatility on the Horizon?
In traditional finance, the U.S. Dollar Index (DXY) surprised the market by breaking through overhead resistance, but it is now taking a breather. The DXY’s RSI is cooling off, and it will be interesting to see whether it respects the recently broken resistance as support on its next pullback. A stronger dollar can often weigh on Bitcoin and other risk assets, so it’s worth monitoring DXY closely over the next few days.
Another chart to keep an eye on is the VIX, which has been pushing higher. Rising volatility in traditional markets could spill over into crypto, especially if macroeconomic or geopolitical events continue to drive uncertainty. Traders should remain cautious during this period, as increased volatility in equities can sometimes precede heightened volatility in the crypto space.
Altcoins: Waiting for a Breakout
At the moment, altcoins seem to be in a holding pattern, with no particularly interesting setups yet emerging. However, it’s worth keeping an eye on 4-hour TBO Close Short clusters, which can provide early signals for potential pullbacks in otherwise bullish market conditions. These clusters are especially useful for traders looking to capitalize on short-term price action, even in a broader consolidation phase.
Conclusion: A Period of Consolidation with Caution Ahead
Bitcoin’s recent rejection at $64,400 and the current consolidation within the daily TBO Cloud suggest that the market is undecided. While some bullish indicators, like RSI resets and stablecoin dominance, point to potential upside, the rejection at key resistance levels cannot be ignored. For Bitcoin to regain its momentum, it will need to break out of this range and stay above critical support levels, particularly the weekly TBO Cloud.
In the meantime, altcoins continue to show strength, and Bitcoin Dominance remains low, reflecting the market’s ongoing interest in smaller projects. However, with rising volatility in traditional markets and a strengthening U.S. dollar, caution is advised.
As always, patience and a strategic approach are key. With Bitcoin at a critical juncture, it’s essential to stay informed and prepared for potential shifts in market sentiment. Keep an eye on key support and resistance levels, as well as altcoin dominance and stablecoin trends, to navigate the next phase of the crypto market cycle.