Bitcoin has been on a tear over the past week, with the price pushing above key overhead resistance and holding strong. After five consecutive days above this previously challenging level, it’s safe to say that Bitcoin has conquered this resistance zone. With the price now targeting higher levels, the question remains: what’s next for Bitcoin, and how are dominance levels shifting in response to this breakout?
Bitcoin’s Price Action: Conquering Resistance
After days of consolidation and pressure building under key resistance, Bitcoin has finally broken through. The price has stayed above the crucial resistance line for five days, which is enough confirmation that this level has been conquered. Currently, Bitcoin is pushing toward the next major resistance at $67,776, with daily RSI showing strength.
Once RSI reaches the previous high of 78.38, we could see a brief pullback to 75, especially as volume remains underwhelming. While Bitcoin’s price action looks strong, it’s important to note that On-Balance Volume (OBV) and trading volume haven’t yet confirmed the move. For Bitcoin to continue its upward trajectory, it needs more volume coming into the market. If volume doesn’t exceed the yellow moving average on the TBT Base/Quote indicator, there’s a chance of a momentary pullback to $65K.
That said, Bitcoin has plenty of momentum, and a proper bull flag breakout doesn’t necessarily require a retest of previously broken resistance. However, a bounce off $65K could make for a more compelling case for continued bullishness, especially as Bitcoin approaches the significant liquidation wall just above $70,000.
The Next Challenge: $70K and Beyond
One of the most significant hurdles for Bitcoin is the massive wall of over $11 billion in short liquidations sitting at $70,319.14. This level is critical for the next phase of Bitcoin’s rally. As Bitcoin inches closer to $70K, short sellers are likely to apply additional selling pressure to prevent a breakout, but this could backfire and create a short-seller liquidation cascade.
A liquidation cascade occurs when derivatives exchanges are forced to liquidate short positions, which forces these positions to market buy at higher prices, further pushing Bitcoin upward. This "reverse waterfall effect" can create rapid price appreciation, potentially propelling Bitcoin well past $70K.
However, this type of price action may not play out until next week, as weekends tend to be quieter in the crypto market. There’s also the possibility that Bitcoin continues to grind higher without revisiting lower levels, but the key takeaway is that Bitcoin’s price action is poised for explosive moves—whether sooner or later.
Bitcoin Dominance: Bullish but Facing Resistance
Bitcoin Dominance (BTC.D) surged alongside Bitcoin’s price, and it’s nearing a possible top ahead of the weekend. Daily RSI for BTC.D is extremely overbought at 81.10, suggesting that the dominance level might be losing steam. Yesterday’s RSI high of 81.97 signals that BTC.D could be near a local top. Still, this doesn’t mean that Bitcoin dominance will fall immediately—RSI can lose strength over several days or even weeks while the price continues to push higher.
On the weekly chart, Bitcoin Dominance looks exceptionally strong. Weekly RSI is sitting at 73.26, with the price well above the TBO Cloud. All four lines of the TBO Cloud are pointing upward, and OBV is trending higher—clear signs of a strong bullish trend.
That said, we may see a minor pullback in BTC.D over the weekend, which could give altcoins a brief window for a recovery. However, the broader trend remains bullish for Bitcoin dominance, meaning that Bitcoin is likely to continue outpacing the rest of the market for the foreseeable future.
Stablecoin Dominance: A Bullish Signal for Bitcoin
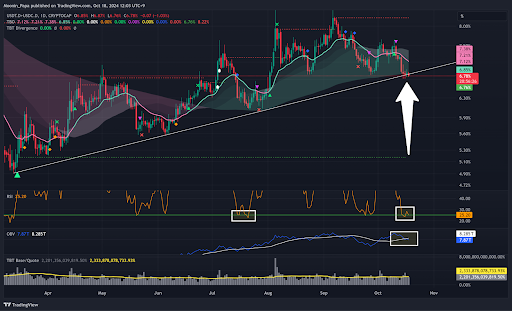
One of the most bullish signals for Bitcoin is the drop in stablecoin dominance. Stablecoin dominance pierced below long-term support and fell beneath the daily TBO Cloud—a strong indicator that capital is flowing out of stablecoins and back into riskier assets like Bitcoin. Daily RSI for stablecoin dominance has reset at 25, which suggests that it will remain weak for a while, supporting further bullish momentum in the crypto market.
On the weekly chart, stablecoin dominance continues to look bearish, which is a positive sign for Bitcoin. RSI is trending lower, confirming that the previous support level is now acting as resistance, and OBV has crossed below its moving average. If stablecoin dominance continues to drop, it could fall to support around 6.28%, further reinforcing Bitcoin’s upward momentum.
Conclusion: Bitcoin’s Path Forward and Dominance Shifts
Bitcoin has successfully broken through key resistance levels, and the next challenge lies just above $70,000. The $11 billion in short liquidations sitting at this level presents both a hurdle and an opportunity—if Bitcoin can break through, it could trigger a massive short squeeze, propelling the price much higher.
While Bitcoin dominance is looking extremely strong, there are signs that a brief pullback could be on the horizon, which may offer altcoins a chance to recover. However, the overall trend remains bullish for Bitcoin, and with stablecoin dominance falling, the broader crypto market is showing signs of strength.
As always, volume will be key. If more volume flows into Bitcoin, the bullish breakout could continue. For now, traders should watch closely for how Bitcoin behaves around the $70K mark and prepare for potential volatility as the market tests new highs.