Gold and Silver broke out again late last week.
Gold closed above $2700 last Thursday and Silver followed Gold’s breakout, with one of its own.
Last Friday Silver closed above $33, surpassing resistance at $32.50 which held Silver since the middle of May. The breakout from a rough inverted head and shoulders continuation pattern projects to a target of $38!
This is quite exciting for the precious metals sector but here are some additional potential breakouts to watch.
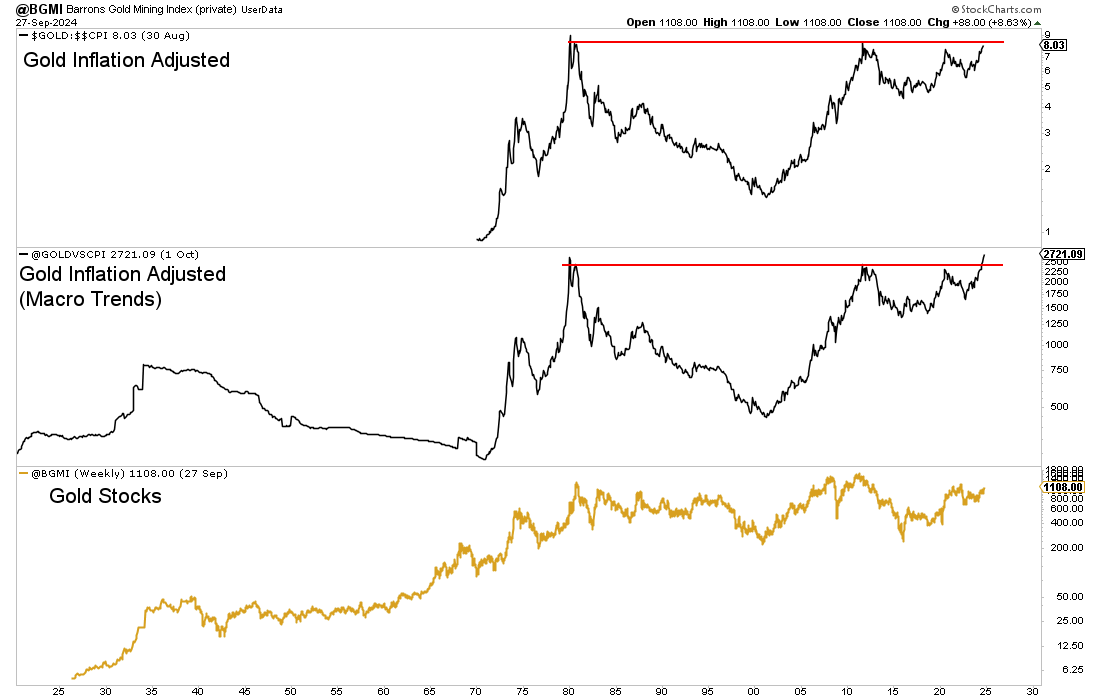
First is the inflation adjusted Gold price. It is significant because it is the best indicator for gold miners over long periods of time.
Data from MacroTrends shows Gold against the CPI is closing in on a 45-year breakout. Data from the top chart is not updated yet but if it were it would look quite similar to the MacroTrends version.
Next up are the miner ETFs against their respective metals.
We plot GDX (top) and GDXJ (middle) against Gold and at the bottom, SILJ against Silver.
The gold stocks are very close to breaking out against Gold and the same can be said about the silver stocks breaking out against Silver.

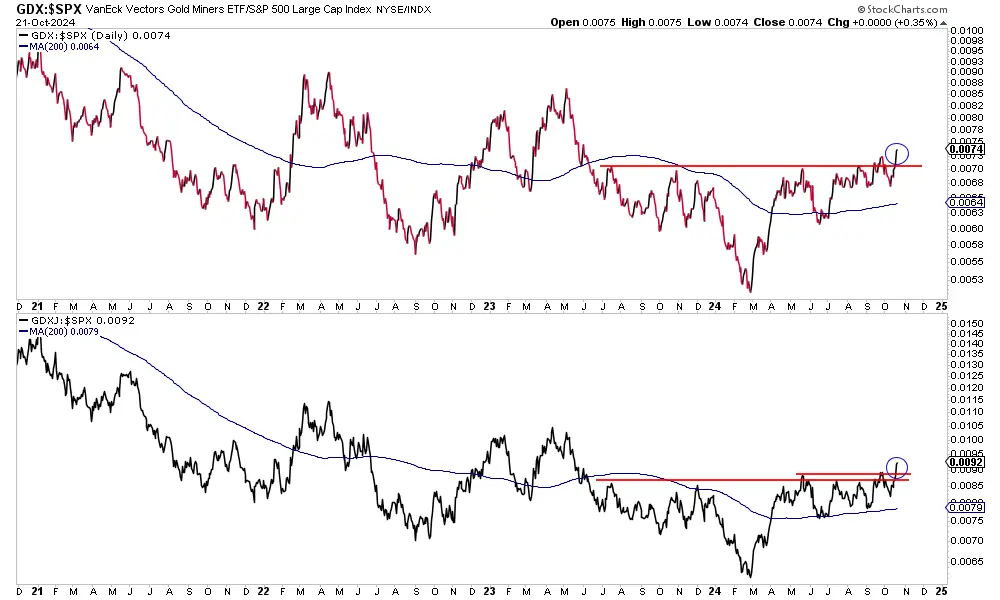
Finally, we plot the gold stocks against the S&P 500.
Gold stocks have broken out to new 16-month highs against the stock market.

The precious metals sector is becoming more overbought but there are plenty of charts to show this move has a long way to go.
The breakout in the inflation-adjusted Gold price has tremendously bullish implications over the coming years.
The strengthening of gold and silver stocks against the metals and also against the stock market has bullish implications over at least the next 12 months.
The way to invest in gold and silver stocks is to continue to focus on quality assets and value. A few months ago I emphasized quality more while now I am focused more on value.
To learn the stocks we own and intend to buy with 5x to 10x potential, consider learning more about our premium service.