
Bitcoin is off to a strong start today, pushing higher after yesterday’s brief pullback and successfully confirming support at the previously broken resistance level. This support confirmation solidifies the bull flag pattern that has been in play since March, with the next major target now set at $126,000 based on the flagpole measurement.
Bitcoin’s Bull Flag: The Golden Scenario

We’ve been tracking this bull flag pattern for months, and today’s price action validates it. Bitcoin bounced off the previously broken resistance level, which has now become support—a textbook bull flag breakout. This confirmation sets the stage for a potential move to the flagpole target of $126,000.

While this is an exciting prospect, it’s important to remember that we shouldn’t expect this move to happen overnight. The flagpole measurement reflects the last parabolic move we saw from January to March during the previous Bitcoin spot ETF hype cycle. It’s a long-term target, and pullbacks are likely along the way.
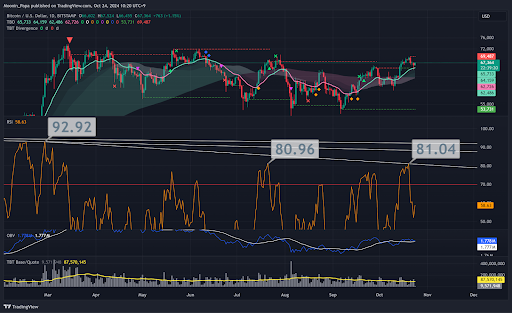
Speaking of pullbacks, they are a natural and healthy part of any bull market. They provide a necessary “reset” for the market and allow for future moves higher. Bitcoin’s daily RSI recently reached an overbought level, peaking at 81.04 on October 20th, before pulling back below 70. This reset gives the market room to breathe and positions Bitcoin for future growth.
Short-Term Consolidation and the Bigger Picture
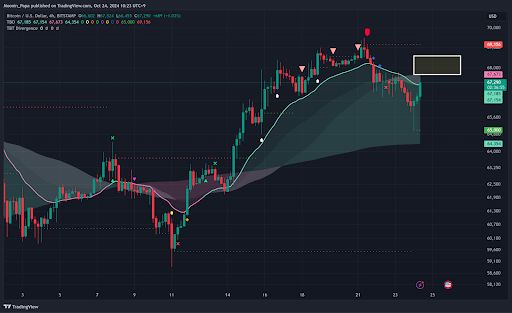
While the daily time frame confirms the bull flag breakout, Bitcoin is currently consolidating on the 4-hour chart. This type of consolidation is typical after a strong move, and we’re waiting for the price to close above the 4-hour TBO Cloud to signal a continuation of the bullish trend. However, because the 4-hour time frame is faster and less reliable than the daily or weekly, we don’t need to overemphasize these short-term signals.
The longer-term outlook remains bullish. Weekly RSI is still climbing, and On-Balance Volume (OBV) is trending above its moving average, which is a great sign for sustained upward momentum. Additionally, Bitcoin’s price is still well above the weekly TBO Cloud, reinforcing the long-term bullish narrative.
Ethereum’s Struggle and Stablecoin Dominance
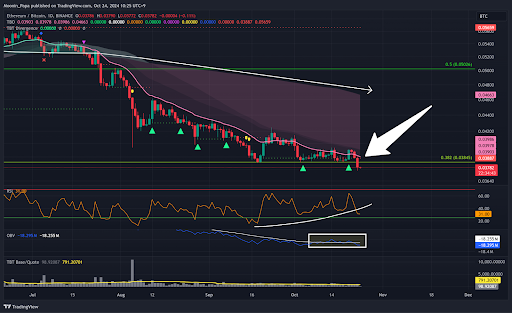
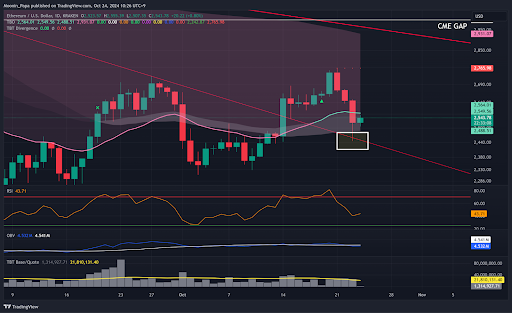
ETH/BTC, on the other hand, saw a pullback yesterday, falling below the 0.382 Fibonacci support level. While this isn’t ideal for ETH, it’s important to keep a flexible mindset when trading and charting. However, ETH is still in good shape overall, as it wicked into previously broken resistance, confirming it as support. As long as Bitcoin remains strong, we can expect Ethereum to push toward $2,900 in the coming weeks.
Another major development occurred in stablecoin dominance. The "price" pierced previously broken support yesterday but didn’t close above it, which is a positive sign for the broader crypto market. We want stablecoin dominance to drop toward 6% or lower, as this would indicate that traders are moving out of stablecoins and back into riskier assets like Bitcoin and altcoins.
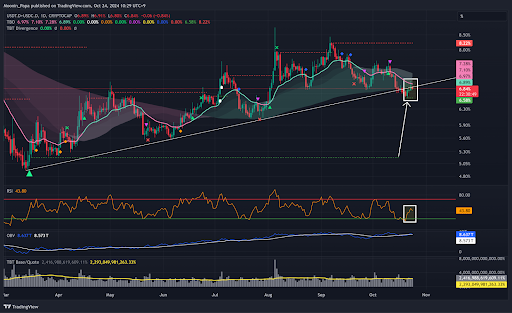
Interestingly, the TBO Support level for stablecoin dominance shot up dramatically from 5.17% to 6.58%. This is a bullish sign for Bitcoin, as it suggests that stablecoin dominance is more likely to fall below this level in the near future.
Bitcoin Dominance and Market Expectations

Bitcoin dominance (BTC.D) remains bullish, holding above the daily TBO Cloud. This suggests that Bitcoin will continue to outperform altcoins for the time being, as is typical during Bitcoin-dominant market cycles. However, OTHERS.D, which tracks altcoin performance, is still below the Cloud and shows signs of compressed price action. This suggests that while altcoins may see brief rallies, the overall trend remains bearish for now.
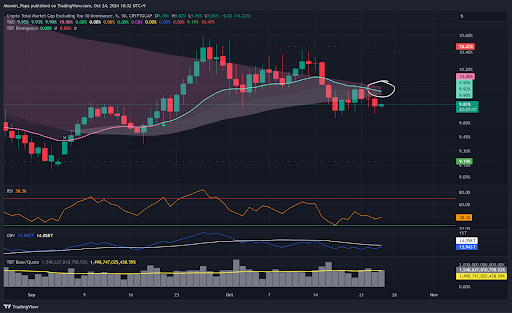
Looking ahead, I expect OTHERS.D to start showing more strength in the next 1-2 weeks as the market evolves, but until then, it’s still Bitcoin season. The total market cap is also bouncing off the daily TBO Fast Line and Cloud, showing resilience as Bitcoin leads the charge.
Bitcoin Volatility and What’s Next

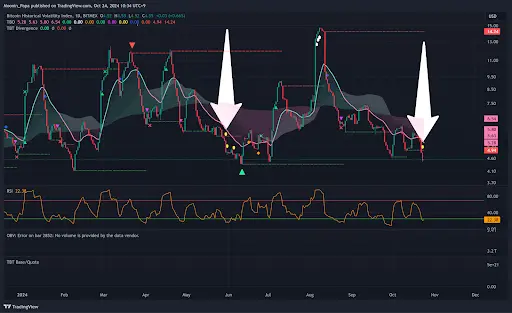
Another important indicator to watch is Bitcoin Volatility (BVOL7D). The TBO Breakdown signal on BVOL7D suggests that volatility is likely to decrease over the next week. While this doesn’t necessarily mean a price drop for Bitcoin, it does indicate that we should expect less dramatic moves in the near term.
As for price targets, the next major resistance for Bitcoin is around $70,167, based on the TBO Resistance level. If Bitcoin can break through this level, it could trigger a much larger move to the upside, especially if stablecoin dominance continues to fall.
Bitcoin on the Verge of Major Moves
Bitcoin is showing incredible strength, confirming key support levels and setting up for a potential breakout to new highs. The confirmation of the bull flag pattern and the resilience of Bitcoin’s price action suggest that we could see much higher prices in the future. However, pullbacks are healthy and should be expected along the way.
Stablecoin dominance is also moving in a favorable direction, and Bitcoin dominance remains strong. While Ethereum and other altcoins are experiencing pullbacks, they are finding support at key levels, setting the stage for potential recovery as Bitcoin leads the market.
The next few weeks will be critical for Bitcoin as it tests higher resistance levels. If stablecoin dominance continues to fall and Bitcoin breaks above $70,000, we could see a much more dramatic move to the upside. As always, patience is key, and pullbacks provide opportunities for those looking to enter or add to their positions.