
Bitcoin kicked off the week with another powerful move, closing just shy of $70,000 on Monday and hitting a local high of $70,218 on Bitstamp. This breakout above long-term resistance reaffirms the bullish momentum that has been building since March, validating the bull flag pattern we've been monitoring and setting the stage for a potential run toward $126,000 based on the flagpole measurement.
Confirmed Support at Key Levels Boosts Bullish Outlook

Bitcoin's bounce from the broken resistance level confirms it as support, an ideal setup for a continued rally. This pattern, coupled with yesterday's TBO Breakout signal, suggests that BTC has solid upward potential. Notably:
- TBO Breakout on Daily Chart: Monday's candle brought a TBO Breakout signal, which historically indicates an increased likelihood of sustained upside. Although breakout signals are common, their positioning matters; when they occur above the daily Cloud—as we see now—they add extra conviction to a bullish setup.
- Strong Daily RSI and Volume Trends: BTC's daily RSI reset from overbought territory, allowing room for further gains without immediate risk of a sharp pullback. Volume is on the rise, with yesterday's trading volume surpassing the moving average, showing renewed interest that aligns with this breakout.
Long-Term Targets: $72K, $74K, and Beyond

With BTC's current strength, the path to $72,000, $73,000, and $74,000 is clearer than it has been in months. Once Bitcoin moves above $74,000, we enter price discovery, where a surge up to the flagpole target of $126,000 becomes more conceivable.

This momentum isn't likely to hit $126,000 within weeks, but the foundational elements are strong. The continuation to $100,000 and beyond will likely be gradual, marked by measured moves and natural pullbacks. These pullbacks aren't setbacks but rather healthy resets that give BTC the strength to push higher.
Bitcoin Dominance and Stablecoin Dominance Support Bullish Momentum
Looking at dominance levels further supports the case for Bitcoin's continued rise:
- Bitcoin Dominance (BTC.D): BTC dominance is edging higher, reflecting the market's renewed preference for Bitcoin as it surpasses critical levels. Daily RSI for BTC.D shows slight weakness, but the trend is still strong bullish, especially on the weekly chart, with BTC.D well above the daily TBO Cloud.

- Stablecoin Dominance: Stablecoin dominance has dropped to 6.69%, and a further decline could ignite more excitement in the market. A drop below 6% would signal even more capital flowing into Bitcoin and other digital assets, providing further fuel for the rally.

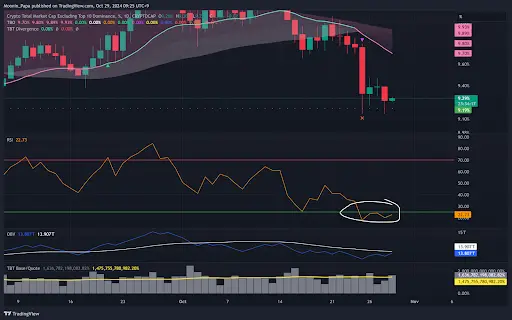
Other Key Market Insights: TOTAL Market Cap and OTHERS Dominance

The TOTAL market cap chart is brushing against overhead resistance, a bullish signal that aligns with BTC's push toward higher highs. Once BTC breaks past its next targets, this should encourage additional upside across the crypto market.

Meanwhile, OTHERS dominance (representing altcoins) is oversold on daily RSI, suggesting a potential bounce back up to the daily TBO Fast Line at 9.7%. This move could create short-term opportunities in ALTs even as BTC remains the market leader.
Bitcoin Is Primed for Further Gains
As Bitcoin holds above $69,000 and sets its sights on new highs, the confirmation of support at previous resistance solidifies this breakout as a pivotal moment. Volume and momentum indicators are aligning, signaling that BTC could be on track for further gains in the near term.
While price discovery won't happen overnight, Bitcoin's current setup provides a compelling case for optimism as we head deeper into Q4. Traders and investors can expect this bull market to bring periods of consolidation, but each retracement offers potential re-entry opportunities. As always, patience is key, but the current trend shows that BTC is firmly in control.