
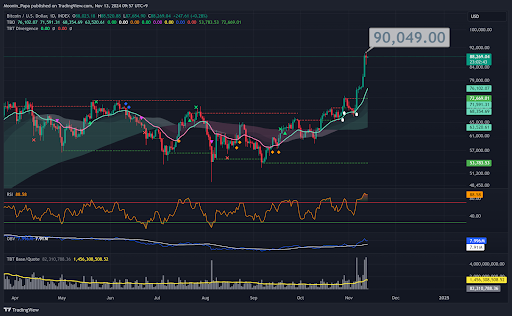
Bitcoin has surged to another new all-time high just north of $90,000. This recent rally is one of the most overextended moves for BTC in years, echoing historic surges during previous bull cycles. While the current price action has been exceptional, let’s take a look at what’s driving this momentum and how it sets the stage for even bigger gains.
The Significance of BTC's Apex Chart and Strong Volume Trend

Bitcoin’s price movements align perfectly with resistance levels mapped by our APEX charts, available in The Better Traders Club Discord Server, hitting nearly the same resistance level it encountered earlier this year. In February, BTC rallied by 42% in just three weeks after moving above resistance, and we’re seeing a similar setup today, with BTC rocketing toward $91,926. Volume, a critical metric for sustained bullish momentum, has been consistently strong, further supporting BTC’s rise. With OBV trending up and RSI on a 7-day overbought streak, the technicals remain highly bullish.
That said, a brief pullback would be natural here, especially with daily RSI entering overbought territory. But this is a macro bullish chart, and any dip is expected to be an opportunity to “Buy the Dip.”
Dominance Levels and Stablecoin Trends: BTC Maintains Control

Stablecoin dominance is showing signs of decline, with the daily TBO Slow line angling downward, suggesting that BTC and crypto assets are increasingly in demand over stablecoins. Stablecoin RSI remains oversold, indicating that while a minor pullback could occur, the long-term trend is strongly in favor of BTC and alts. Bitcoin Dominance remains above 60%, a clear sign that BTC is still the market’s driving force.

While Bitcoin Dominance recently saw a minor pullback, it quickly retraced, emphasizing BTC’s control in this market cycle. As BTC dominance continues to climb, altcoins (OTHERS.D) have struggled to keep up. However, a recent TBT Bullish Divergence signal hints at a potential bounce in altcoin performance once BTC stabilizes.
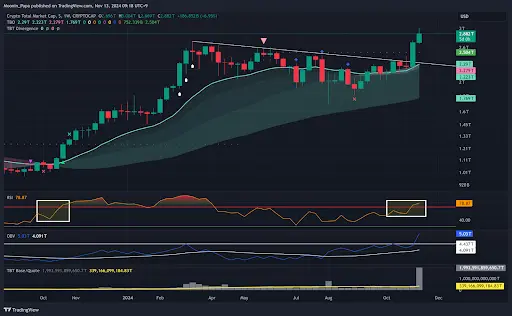
Macro Crypto Market Cap: Strong Uptrend with Huge Upside Potential

The TOTAL crypto market cap chart is displaying remarkable strength, with multiple bullish indicators firing across the weekly chart:
- RSI is firmly overbought, a sign of strong upward momentum.
- OBV has exceeded its previous high from March.
- Trading volume has been robust, indicating a steady inflow of capital into the crypto market.

The TOTAL crypto market cap has retraced to its all-time high from November 2021, and Fibonacci extensions suggest further upside, with projections ranging from 43% to as much as 136% growth.
OTHERS Market Cap Chart: A Prime Opportunity

While the OTHERS.D dominance chart may look weak, the actual market cap of OTHERS (altcoins) is poised for significant growth. The OTHERS market cap chart is above the cloud, volume is strong, and OBV is picking up. Fibonacci levels suggest that OTHERS could rise between 213% and 509%, representing a substantial opportunity for altcoin gains as BTC’s rally matures. This potential return illustrates why altcoins are worth close attention and investment when conditions are favorable.

Market Strategy: Buy the Dip, DCA, and Let Positions Ride
As we enter the first phase of the bull market, now is the time to be strategic and, yes, a bit greedy. With strong bullish sentiment across major indicators, any pullbacks present an opportunity to add to positions. A DCA (dollar-cost averaging) strategy remains ideal in such an environment, and holding positions rather than taking quick profits may yield greater rewards. The crypto market is transitioning from a conservative phase to a growth phase, making this the time to let gains compound.
In summary, Bitcoin’s record-breaking rally and the strength across market indicators signal that this bull market is just getting started. Whether you’re focused on BTC or looking to diversify into alts, this could be a rewarding time to build and hold positions in anticipation of further upside.