In a quiet US data week, gold prices has started the week on the front foot by moving to the upside and recovering some of the losses that it experienced in the past few days. Traders are looking at the gold price and asking themselves this very question which is if the price action will continue its price momentum to the upside by not only recovering recent losses and a gradual move towards a new all time high or if the price of the shinning metal will fall further as the floor hasn’t hit by the price action.
Gold’s Price Action
Gold prices have recorded two consecutive weeks of losses as of Friday last week as most traders and investors have been in the profit taking mode. However, if we zoom out a little and focus on the monthly chart for the gold price, one would see that the precious metal hasn’t recorded any losses for months as the last negative month for the yellow metal was in June and the one before that was in January this year. So it would be very much fair to say that the price is set for a stellar rally for this year as only two months so far have been negative and even then the price action was able to recover its loses very easily.
Although, the gold price is very much in a strong uptrend but for speculators the main game in terms of price target is the level of 3,000 USD per ounce and the current believe among them is that the odds are becoming weaker for the gold price to touch that level by the end of this year as fundamentals have shifted.
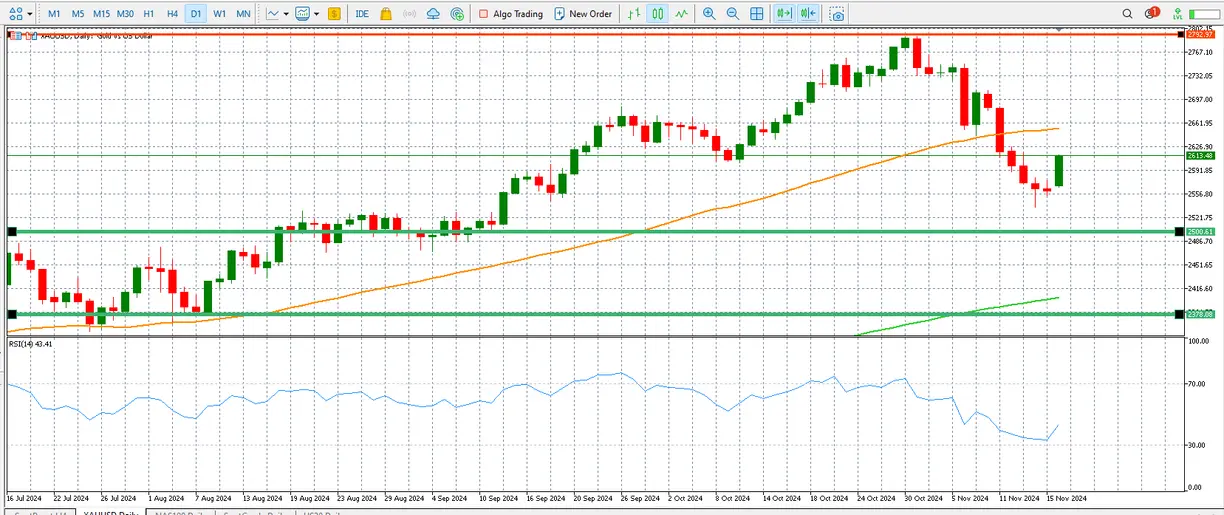
Speaking from a technical price perspective, gold bulls are very much in control of the price action if we look at the daily time frame and this is because the price is trading still well above the 200-day simple moving average (shown in green) on the chart below. However, the momentum to the upside is under threat as the shinning metal’s price has recently broken below the 100-day simple moving average. If the price doesn’t recover from this set back and that is if the price doesn’t move back above the 100-day SMA on the daily time frame, we could be looking at a situation where more weakness may be heading towards the yellow metal.
However, the RSI, the Relative Strength Index, is telling a story which bulls would like very much and that is the current price action of the yellow metal is very much oversold. This means that the price action is going to be highly favourable in the coming days as many traders believe that sell off has been over cooked and there is room for improvement.
Putting both arguments together, what this really mean is that it may be true that the current price action may be oversold and this means that a correction is on the table. However, in order for the price action to really continue its momentum to the upside, the price must be able to overcome its next challenge which is moving above the 100-day SMA (the yellow line).

The trading gold chart from MT4 trading platform shows important price level for trader on the daily time frame.