Bitcoin's recent pullback has been driven by significant profit-taking activity, with long-term holders reportedly selling over 728,000 BTC in the past month, equivalent to nearly $67 billion. This sell-off has brought substantial volume into exchanges, consistently outperforming the 30-day moving average. Despite this short-term correction, the daily TBO Slow line remains angled upward, reinforcing the macro bullish trend. Pullbacks like this are not only expected but also necessary to reset overbought conditions and build a stronger foundation for future price growth.
Short-Term Stabilization on the Four-Hour Chart
Examining the four-hour Bitcoin chart reveals early signs of stabilization. RSI reached oversold levels early yesterday and has not fallen below that low, which is a positive indicator for a potential bounce. However, the four-hour chart provides weaker signals compared to daily or weekly time frames. The daily TBO Fast line at $89,500 remains a likely short-term target for Bitcoin. As price action consolidates within the four-hour TBO Cloud, this bearish consolidation appears temporary, with the overall trend remaining firmly bullish.
Stablecoin Dominance Signals Market Transition
Stablecoin dominance has recently touched the daily TBO Fast line, marking the first significant response to the Bitcoin pullback. Despite this upward move, the TBO Slow line for stablecoins remains bearish, aligning with a bullish outlook for Bitcoin and altcoins. Interestingly, Bitcoin Dominance has been surprisingly flat during this pullback, deviating from the typical pattern of increasing dominance when Bitcoin prices decline. This stagnation suggests potential shifting sentiment toward altcoins, although Bitcoin remains the primary driver of market momentum.
Altcoins Show Early Signs of Strength
OTHERS.D, which tracks smaller-cap altcoins, is showing encouraging signs of bullish momentum. The daily TBO Cloud has tightened significantly, and the TBO Slow line has flattened out, indicating that altcoins may be approaching a breakout. Weekly reversal signals on OTHERS.D add to the optimism, though these may take weeks to fully materialize. While altcoin market cap growth is still in its early stages, these indicators suggest the potential for a significant rally in the near future.
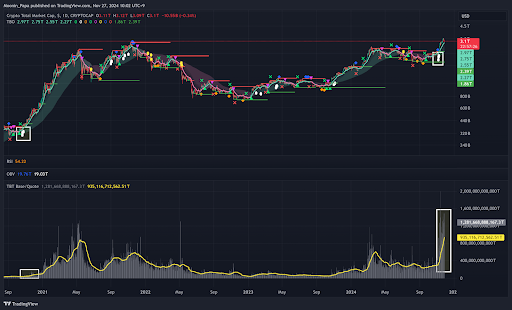
Volume Trends Mirror the 2020 Bull Run
Volume trends across the TOTAL crypto market cap chart echo the late-2020 period, a time that marked the beginning of the last bull market. The current pullback to the November 2021 all-time high of $3.01 trillion appears to be a natural pause within a broader upward trajectory. Consistently strong volume exceeding the 30-day moving average and upward-trending On-Balance Volume highlight the market's strength. Notably, the weekly OTHERS chart has yet to print a TBO Breakout cluster, a signal that typically precedes major altcoin rallies, suggesting substantial room for further growth.
Preparing for the Next Phase of the Market Cycle
Bitcoin’s pullback provides traders with an opportunity to reassess their strategies and prepare for the next market cycle phase. The long-term bullish narrative remains intact, supported by strong volume trends, dominance shifts, and macro indicators. Traders should view this correction as an opportunity to accumulate at favorable prices. Dollar-cost averaging remains a prudent approach, allowing participants to position themselves effectively for the next leg of the rally. While Bitcoin's consolidation commands attention, the broader crypto market shows promising signs of resilience and growth, setting the stage for continued upward momentum in the months ahead.