

Bitcoin Holds Steady, Awaiting a Breakout
Bitcoin's recent bullish close, up 4.5%, reinforces the underlying macro bullish trend, even as consolidation persists. The daily TBO Cloud and TBO Slow line continue to point upward, affirming the overall strength of the market. However, short-term indicators like OBV and RSI are signaling sideways chop, with OBV's white MA line flattening out and daily RSI developing resistance levels.

The key challenge remains the $103k level, the 1.272 Fibonacci Extension, which has proven to be a formidable resistance. Until Bitcoin closes above this level on the daily chart, it will likely continue to trade in a constricted range, requiring significant energy to break higher.
Ethereum and Market Caps Reflect Bitcoin's Consolidation

Ethereum saw a slight boost, closing up 5.6% after Bitcoin's bullish performance. However, ETH remains stuck under the psychological $4,000 resistance level, which now appears to be a major barrier for sustained bullish momentum. Indicators like OBV, RSI, and volume are neutral to bearish, further highlighting Ethereum's struggles.

The broader market caps, including TOTAL, TOTAL2, TOTAL3, and OTHERS, show similar patterns. None have closed inside the daily TBO Cloud, maintaining their bullish structure. Their respective TBO Slow lines are still pointing upward, underscoring the resilience of the macro trend.
Dominance Shifts Signal Ongoing Opportunities

Dominance levels reveal a dynamic market landscape. Bitcoin dominance (BTC.D) remains slightly elevated due to the recent altcoin sell-off, while stablecoin dominance dipped to 5.05% before rebounding inside the TBO Cloud. This bounce signals potential short-term fear in the market but is not yet indicative of a sustained bearish trend.

OTHERS.D continues to hold above its daily TBO Cloud, signaling some resilience in the altcoin market despite recent pullbacks. The upward curling of the daily TBO Slow line across dominance charts hints at improving conditions for altcoins in the medium term.
Key Lessons: Focus on Strong Trends During Pullbacks
Recent market activity highlights two essential strategies for traders and investors in bullish conditions:
- Use the TBO Fast Line as a Guide for DCA Opportunities: Significant pullbacks often see prices return to the daily TBO Fast line, offering strategic entry points. For instance, BNB, XRP, and SUI exhibited strong recoveries after bouncing off the TBO Fast line during the latest dip.
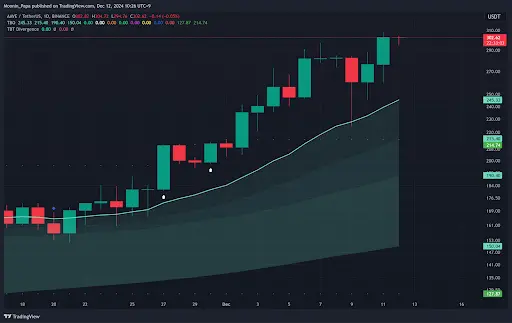
- Prioritize Strong Bullish Trends: The angle and direction of the TBO Slow line provide critical insight into the strength of a chart's trend. Charts with sharply upward-sloping Slow lines, like AAVE, recover faster and perform better than those with weaker trends, such as NEAR. This approach ensures a focus on assets with the highest probability of sustained momentum.

Outlook: Patience Is Key
As Bitcoin consolidates, altcoins continue to exhibit mixed signals. While some charts show promising recovery bounces, others remain subdued. The broader crypto market retains its bullish macro trend, supported by strong volume and upward-trending indicators. For traders and long-term investors, patience and discipline are crucial as the market navigates this consolidation phase. Remember to focus on strong trends and strategic entries during pullbacks to maximize gains during the ongoing bull cycle.