
Bitcoin Breaks New Highs, Sets Sights on $117K
Bitcoin reached another all-time high yesterday, climbing close to $108,000. Daily RSI broke above its resistance line, signaling growing momentum, while volume showed its strongest reading since December 5th. On-balance Volume (OBV) remains bullish, trending above its moving average, and the price continues to trade well above the daily TBO Cloud with all four lines pointing up.

A notable bullish development was Bitcoin’s recent retest of the 1.272 Fibonacci extension level as support. This “bump and run” setup confirms the level around $102,000 as a foundation for the next move upward. With momentum building, Bitcoin’s next target is the 3.272 Fibonacci extension at $117,716. However, traders should prepare for increased volatility as BTC approaches this significant level, given the historical challenges seen at previous Fib extensions. Fibonacci levels should be viewed as general price ranges, and with the market continuing to climb, Bitcoin is showing no signs of slowing down over the long term.
Ethereum Struggles at $4,000

Ethereum continues to face challenges at the critical $4,000 resistance level, indicating significant sell pressure. Despite outperforming Bitcoin on occasion, ETH remains stuck beneath this psychological barrier.

On the 4-hour chart, the price action appears suppressed, likely due to a large sell wall, while demand remains weak. Until ETH can close convincingly above $4,000, its bullish momentum will remain muted.
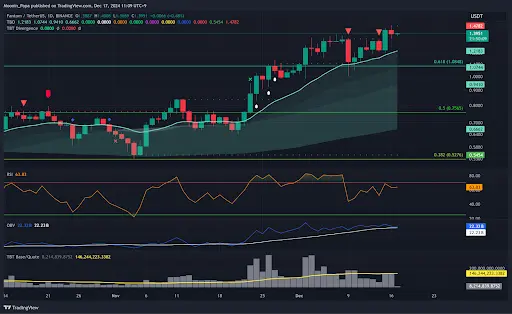
Stablecoin Dominance Shows Early Warning Signals

Stablecoin dominance printed a TBT Bullish Divergence signal, raising caution for potential reversal. While the TBO Slow line remains bearish, consistent signals like these—especially if clustered—demand attention. If stablecoin dominance rises further, it would signal increased fear in the market and could trigger a broader pullback for BTC and altcoins.
Still, stablecoin dominance remains below its daily TBO Cloud, and both OBV and the TBO Slow line are trending downward. While a bounce is possible, the broader trend remains bearish for stablecoins—a positive indicator for risk assets like Bitcoin and altcoins.
Bitcoin Dominance Holds Control

Bitcoin dominance (BTC.D) has recovered back inside the daily TBO Cloud, suggesting bullish consolidation. OBV crossed bullishly above its moving average, and RSI has moved into the overbought zone.

On the weekly chart, BTC.D is now above the TBO Cloud, reinforcing Bitcoin’s control over the market for the time being. Until the weekly TBO Slow line begins to flatten, BTC.D will likely continue trending upward, keeping Bitcoin as the market driver while altcoins take a back seat.
Altcoins Pause as Market Watches Bitcoin

OTHERS.D, representing altcoin dominance, dipped back into the daily TBO Cloud, signaling bearish consolidation. Although altcoin market cap charts (like TOTAL3) remain relatively stable, altcoins appear to be waiting for Bitcoin to make its next decisive move. This reinforces the importance of closely monitoring Bitcoin’s price action during consolidation periods.

While some isolated altcoin opportunities remain—such as Fantom’s bullish strength and individual bounce signals like AR and BRETT—the broader altcoin market is holding its breath as Bitcoin dictates the next direction.
Final Thoughts
Bitcoin’s push to $108,000 and its confirmation of support at the 1.272 Fibonacci extension is a major bullish signal. The next resistance at $117,000 represents a significant hurdle, but history suggests Bitcoin has further room to run. Meanwhile, Ethereum struggles at $4,000, and altcoins remain in a state of pause as traders await Bitcoin’s breakout.
For traders and investors, the key is to stay focused on Bitcoin’s price action, monitor stablecoin dominance for early reversal signals, and remain patient during altcoin consolidation. The broader trend remains bullish, and while pullbacks are inevitable, the macro picture continues to favor higher highs in the months ahead.