
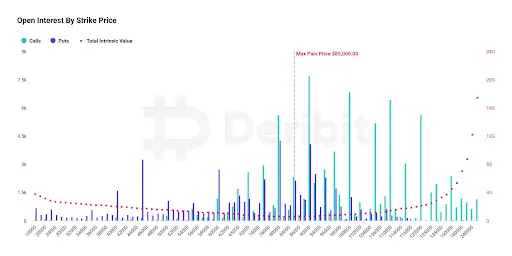
Bitcoin closed down -3.63% on yesterday's candle after its promising recovery bounce earlier this week. This decline coincides with the expiration of $14.5 billion in BTC options on Deribit, with a max pain price of $85,000.

While these expirations could explain part of the drop, they don't fully account for the lackluster performance.

The 4-hour chart reveals newly formed resistance, with RSI breaking support and OBV remaining flat. Volume is also significantly below levels seen weeks ago. Without a strong short-term trend or volume, Bitcoin's price action remains uninspiring. The daily time frame mirrors these struggles, with RSI and OBV underperforming and a potential red TBO Cross Down forming on today's candle, though it's too early to confirm.
Bitcoin's inability to break above the 1.618 Fibonacci extension from the March top highlights its current struggle. However, it has yet to close below this level, maintaining some hope for support.

Meanwhile, Ethereum's situation appears weaker, as it failed to breach the top of its daily TBO Cloud and remains stuck in bearish consolidation. Volume for ETH has also dried up, and the daily TBO Slow line has flattened, further dampening its outlook.
Dominance Levels and Mixed Crypto Signals

Stablecoin dominance popped back inside its daily TBO Cloud, with the cloud turning grey, signaling potential consolidation rather than bearish continuation. This shift dampens hopes for a swift return to a greed-driven market.

Bitcoin dominance (BTC.D) has climbed back above the daily TBO Cloud, though its weekly chart shows continued weakness, with wicks back into the cloud signaling indecision. A move above resistance on BTC.D could pressure altcoins further, but the current lack of strong signals leaves the market in limbo.

OTHERS.D continues to struggle below its daily TBO Cloud. However, the weekly chart shows a TBO Close Short signal still in progress, a bullish sign if it confirms.

The TOTAL crypto market cap chart sits precariously on weak support, with a TBO Close Long printed on yesterday's daily candle. While daily RSI shows resistance, OTHERS appears poised for a potential recovery today, supported by BVOL7D retreating from the reversal zone, signaling traders' growing confidence in altcoins.

SDEX Outperforms Amid Market Weakness

While Bitcoin and Ethereum wrestle with resistance, SDEX continues to shine. It closed a TBO Breakout yesterday and is on track to print another. The price has surpassed the 0.618 Fibonacci Retracement level, a significant milestone, and now targets the 0.786 Fib level, approximately 17% above its current price. Historical TBO Resistance just below 0.020 could present a hurdle, but the momentum for SDEX remains strong.

Volume for SDEX has been steadily increasing on Bitget since early December, reinforcing its bullish trajectory. The chart also shows a predictive wick at 0.025, suggesting further upward potential. With consistent volume, SDEX could reach this level within weeks, nearing its all-time high of 0.026788. This resilience positions SDEX as a standout performer amid broader market turbulence, with strong prospects heading into the new year.