

Bitcoin experienced a dramatic wick down to $89,224, momentarily piercing critical support levels before staging a rapid rebound. This unexpected move has sparked discussions of market manipulation, as the swift recovery signals strong demand at lower levels. However, the price action also raises concerns that BTC could revisit the $89K mark, given the predictive nature of long lower wicks in similar setups.

On the 4-hour chart, On-Balance Volume (OBV) suggests the recent dip was not backed by significant selling volume, reinforcing the theory of a manipulated move. Additionally, RSI on the same timeframe bounced back above a key support line, signaling potential strength. Despite this, the broader outlook remains cautious as Bitcoin's daily candle exhibits characteristics that could foreshadow further downside.
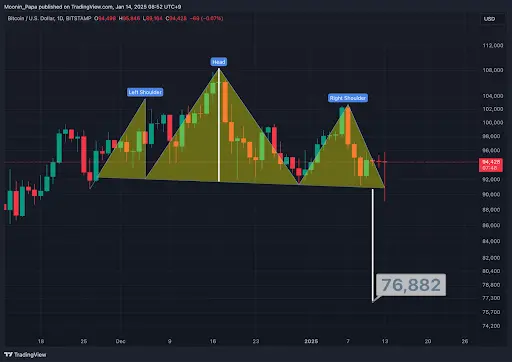
Key Support Holds, but Risks Remain

The $91K support level continues to act as a crucial pivot point. While Bitcoin managed to recover above it, the piercing of this level has left the door open for further declines. A confirmed break below $91K would validate the Head & Shoulders pattern currently in play, targeting $77K as the next major support.

Interestingly, historical patterns suggest that January pullbacks often have quick recoveries, as evidenced by a 2021 trend of sharp declines followed by swift rebounds. However, the current pullback, now at -13% over seven days, has unfolded more slowly, raising questions about whether it fits the same mold.
Dominance Charts Highlight Uncertainty

Bitcoin dominance (BTC.D) has reached overhead resistance, a critical level that could dictate the next phase of market sentiment. While OBV shows an uptrend, RSI on the daily chart is weakening, suggesting a potential reversal. If BTC.D breaks resistance, Bitcoin could enter "honey badger mode," overshadowing altcoins. Conversely, a rejection here could shift dominance in favor of OTHERS.D.

OTHERS.D, representing altcoins, is showing signs of bearish consolidation within the daily TBO Cloud. A push above the 12% resistance level is essential for altcoins to regain momentum. Until then, they remain under pressure, especially during Bitcoin's volatile moves.
Stablecoins and Market Sentiment

Stablecoin dominance has surged during Bitcoin's recent decline, reflecting heightened market fear. The daily chart is on the verge of printing a TBO Open Long, signaling bullish consolidation for stablecoins. However, daily RSI shows signs of cooling off, and the TBO Slow Line remains bearish, offering a glimmer of hope for a reversal.
TradFi and Macro Indicators: DXY and Gold

The U.S. Dollar Index (DXY) continues its climb, making a new high. However, daily RSI shows clear signs of weakening, suggesting the rally may be losing steam. A potential double top formation could signal a broader market reversal, which would be bullish for crypto.

Gold, often seen as a safe-haven asset, has moved above the daily TBO Cloud and is poised for further gains. With a TBO Cross Up in progress, the metal could make a J-shaped move higher, especially if DXY maintains its upward trajectory.
Looking Ahead: The Trump Factor
The crypto market is eagerly awaiting potential catalysts tied to the incoming U.S. administration. President Trump's crypto-friendly stance and plans to position the U.S. as a leader in crypto development could spark a "Trump Pump." However, until such events materialize, volatility is expected to remain high, with Bitcoin potentially revisiting $89K before finding stability.
Long-Term Bullish Outlook
Despite short-term bearish signals, the macro outlook for Bitcoin and the crypto market remains bullish. As 2025 is projected to be a top year for Bitcoin, the current volatility may offer buying opportunities for long-term investors. While the immediate path forward may be rocky, the ultimate direction for Bitcoin is higher.