Since the last US interest rate decision on December 18th, 2024, gold has experienced a remarkable recovery as anticipated. From its low point of USD 2,585, it climbed to a recent high of USD 2,697 within three weeks, representing an increase of approximately 4%. This recovery, however, has taken its toll as it had led gold to a significant resistance in the form of the upper triangle boundary. This downward trendline is currently situated around the USD 2,679ish level and has acted as short-term resistance triggering a pullback at the beginning of this new week. With the latest CPI numbers released today, gold was able to leave that technical barrier behind. Prices rallied back up towards USD 2,696 again. So far, however, this breakout is not yet a done deal, as gold came back down testing the former resistance for support. But it looks promising!
Chinese Central Bank Resumes Gold Purchases
Independent of short-term price fluctuations, the People’s Bank of China (PBOC) resumed gold purchases in November 2024 after a six-month hiatus, acquiring a total of 15 tons of gold in November and December. These strategic purchases have increased China’s official gold reserves to approximately 2,280 tons, still significantly lower than the United States’ 8,133.5 tons. The move represents a deliberate effort to diversify currency reserves, reduce dependence on the US dollar, and hedge against geopolitical tensions and economic uncertainties. Despite gold trading near record highs, the PBOC continues its long-term strategy of increasing gold’s proportion in its total reserves.
Market Implications and Strategic Context
Since early 2023, China’s foreign exchange reserves have grown by approximately USD 830 billion, with about 80% of this increase attributed to gold value appreciation. We can anticipate that central bank demand, particularly from China, will continue supporting gold prices. Even in potential stock market downturns, the support level around USD 2,500, with further significant price drops only conceivable during extreme deflationary or liquidity shock scenarios. The PBOC’s consistent gold acquisitions signal a profound trust in gold as a strategic asset, demonstrating a commitment to building reserves independently of current market prices and maintaining financial resilience.
Gold with incredible resilience
Despite a strong US-Dollar, gold has demonstrated remarkable resilience, rebounding from December lows due to a combination of factors including post-US election stabilization, ongoing supply constraints, and evolving central bank policies. The Federal Reserve’s rate cut decisions and indications for 2025 have impacted gold’s appeal, while persistent geopolitical tensions and economic uncertainties continue to support its safe-haven status. Investors should remain vigilant as the market navigates this crucial resistance level. The coming days may determine whether gold can sustain its recovery or if a consolidation phase is imminent.
Gold in US-Dollar, Weekly chart
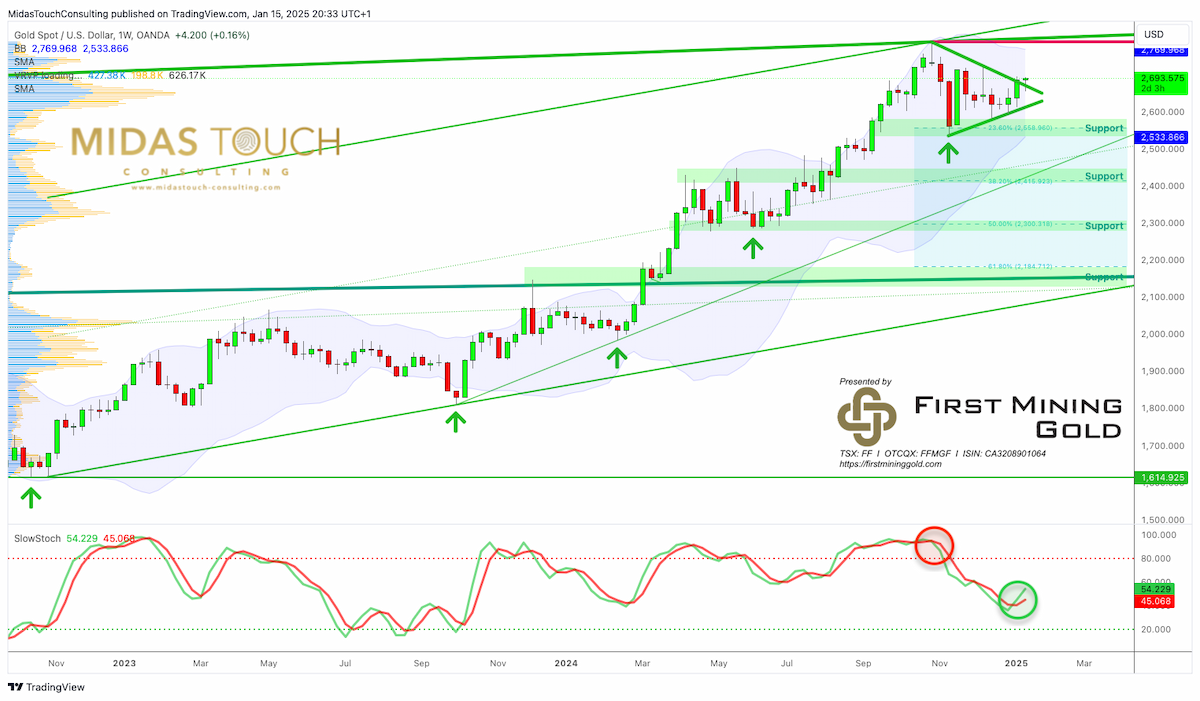
Gold in US-Dollar, weekly chart as of January 15th, 2025. Source: Tradingview
Technically, gold is still consolidating its strong advance of 2024. Since the new all-time high at USD 2,790 in late October 2024, gold has been mainly moving sideways between USD 2,600 and USD 2,700, roughly speaking. Over time, a triangle formation has developed which in most cases is a trend confirming pattern simply pointing to a period of consolidation and accumulation. As the trading range narrows the breakout is coming closer. Given the whole structure of gold’s advance coupled with the positive seasonailty, we assume that the breakout will come to the upside. However, it could still take a few more weeks until the gold market is really ready for that move.
Looking at the weekly chart, the stochastic oscillator has turned around, suggesting a new up-move is already underway. Although the oscillator never became oversold during the recent pullback, it showed the lowest reading of 2024 just a few weeks ago. In bull markets, the weekly stochastic oscillator often does not reach extremely oversold levels due to the underlying strength and momentum of the uptrend.
Overall, the weekly chart gives a cautiously bullish impression. The new buy signal from the stochastic as well as the triangle formation suggest a continuation of the upward movement in the near future. Once gold has cleared the resistance zone between USD 2.700 and USD 2,727, the all-time high at USD 2,790 might be tested quickly.
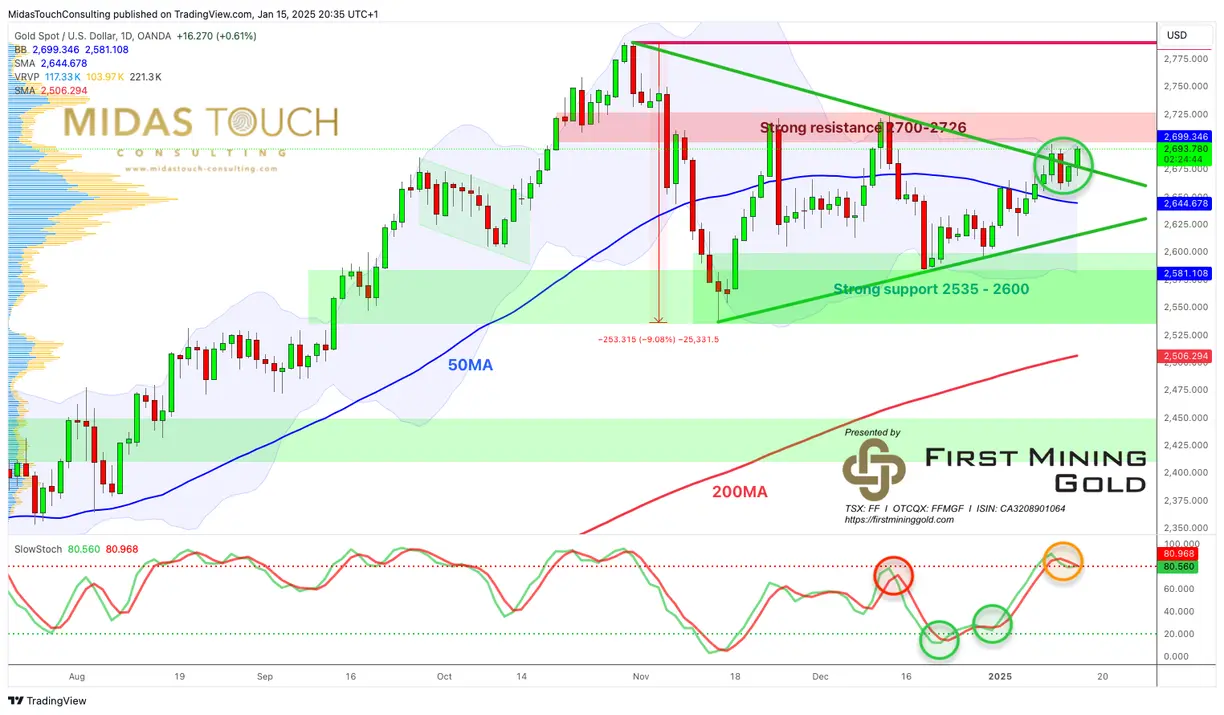
Gold in US-Dollar, Daily chart
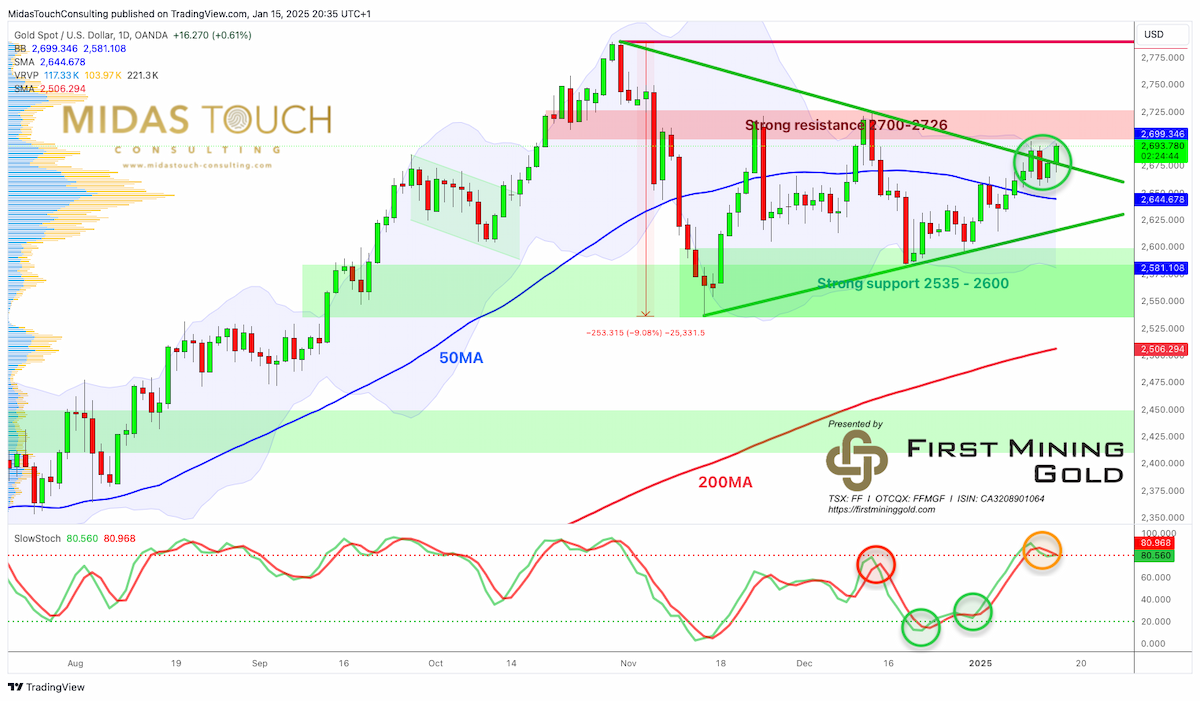
Gold in US-Dollar, daily chart as of January 15th, 2025. Source: Tradingview
On the daily chart, gold has reached its upper Bollinger band (USD 2,696) while trading comfortably above its 50-day moving average (USD 2,644). Obviously, gold is trying to break out from its triangle formation which has capped prices for the past two and a half months.
However, it’s not clear yet if gold can overcome this critical juncture directly. Another attempt towards USD 2,700 would confirm the successful breakout. On the other hand, a pullback towards the 50-day moving average would indicate another round of consolidation within the triangle pattern. Even a pullback towards USD 2,620ish would be acceptable. Only a daily close below USD 2,600 would provide more reason for skepticism.
In total, gold is gathering strength and seems to get ready to break out of the triangle. With directly or with another round of consolidation, we assume that gold will trade higher by February and will attack its all-time high at USD 2,790 in the next one or two months.
Conclusion: Gathering strength for the breakout.
Gold’s recent performance and technical analysis paint a cautiously optimistic picture for the precious metal in early 2025. The metal has shown remarkable resilience, rebounding from its December 2024 lows to challenge key resistance levels. The triangle formation, coupled with a new buy signal from the weekly stochastic oscillator, suggests a potential continuation of the upward movement. This technical setup, combined with seasonal support, indicates that gold may be poised for a breakout to the upside, potentially targeting its all-time high of USD 2,790 in the coming months.
The People’s Bank of China’s resumption of gold purchases in late 2024 adds a significant fundamental factor to the bullish case for gold. This strategic move, aimed at diversifying currency reserves and reducing dependence on the US dollar, underscores the ongoing demand from central banks. China’s consistent acquisition of gold, regardless of market prices, signals a long-term commitment to the metal as a strategic asset. This persistent demand is likely to provide underlying support for gold prices, with the USD 2,500 level serving as a potential floor in the event of market turbulence.
As we move further into January and February 2025, investors should closely monitor gold’s interaction with key technical levels, particularly the resistance zone between USD 2,700 and USD 2,727. A successful breach of this area could quickly lead to a test of the all-time high. However, the market may still require additional consolidation before making a decisive move. Factors such as Federal Reserve policy decisions, geopolitical tensions, and economic uncertainties will continue to influence gold’s trajectory. While the overall outlook appears favorable, investors should remain vigilant and prepared for potential volatility as the market navigates this crucial juncture in gold’s price action.