Jan 21, 2025
- Money managers invested in the US stock market don’t care if US borders are open or closed. They don’t care if elementary schools teach wokeness and critical race theory. They do care about taxes… and whether they are implemented with carpet bombing madness or a reasonable strategic plan.
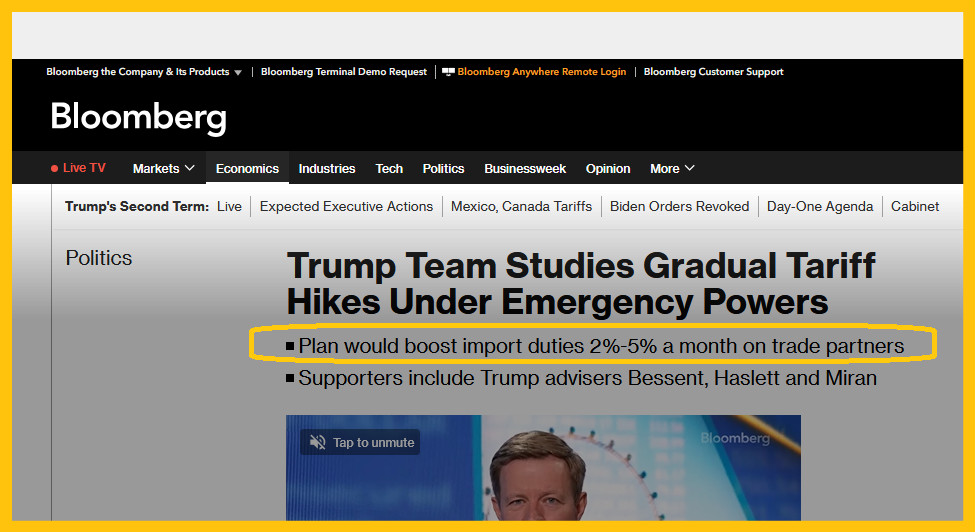
Institutional investors in both the stock and gold markets have embraced the new administration’s decision to approach new taxes with a much more strategic mindset than was communicated during the election campaign.
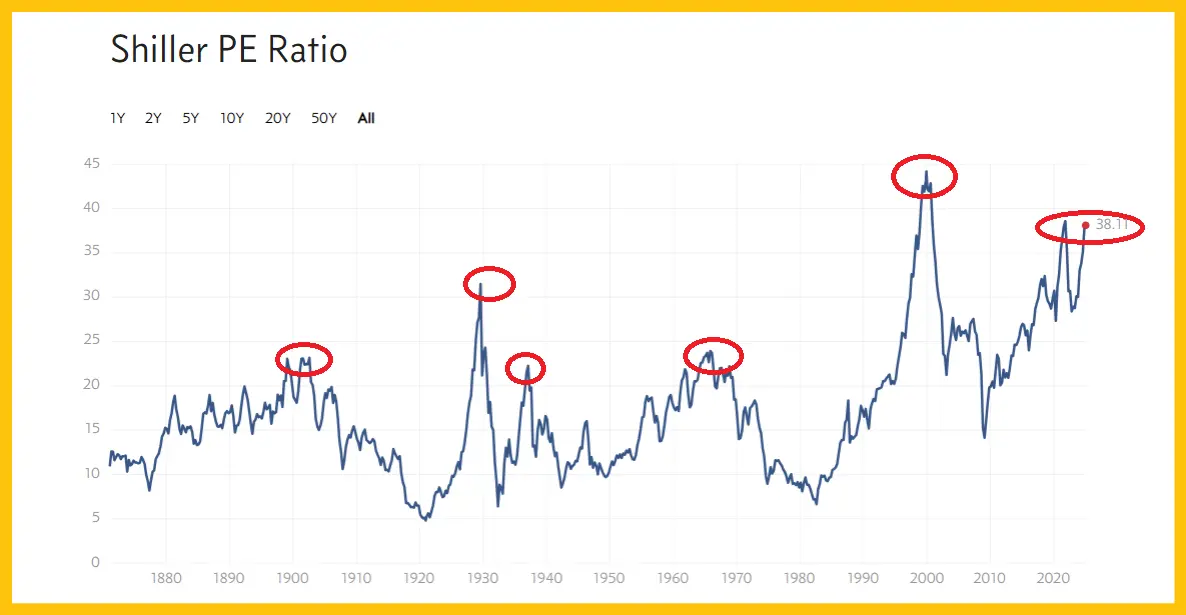
Double-click to enlarge this Cape/Shiller ratio chart for the US stock market. On the one hand, there’s no question that the market is overvalued.
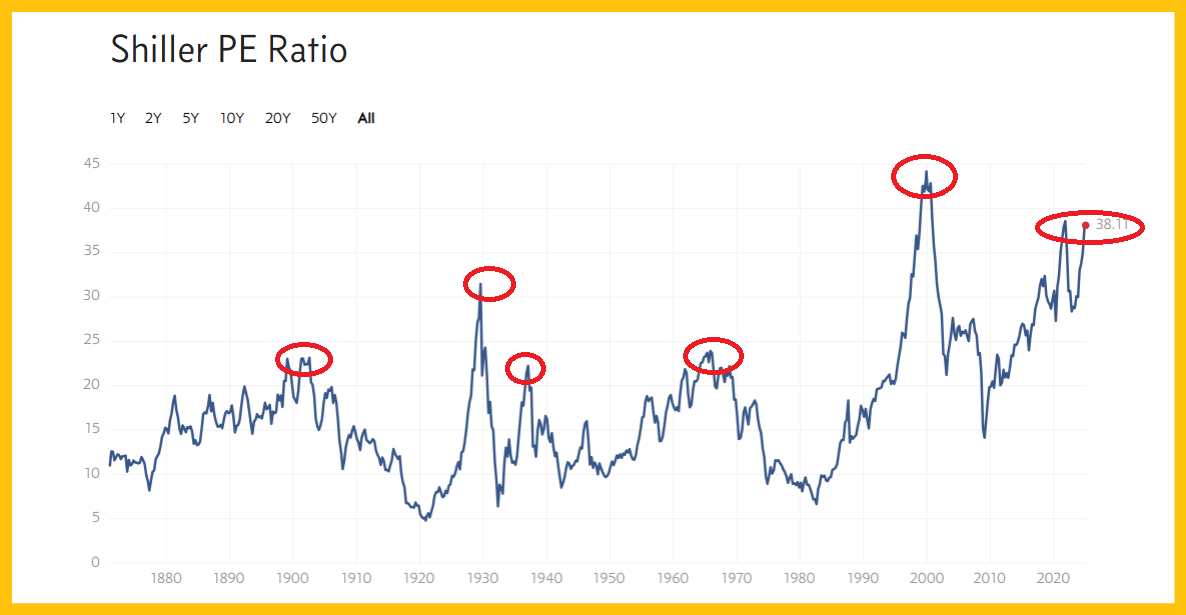
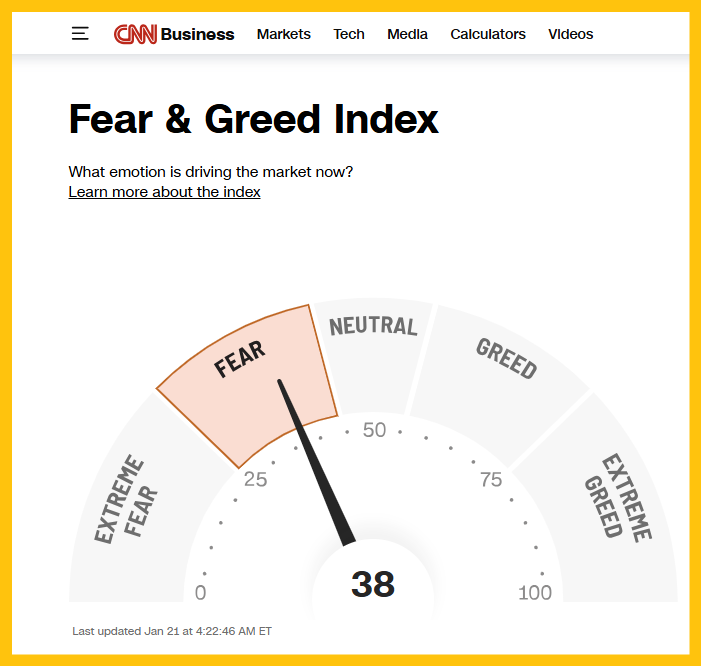
On the other hand. In the short-term, sentiment is still in the fear zone. That bodes well for a rally.
This weekly chart of the Dow is clearly positive for the medium term.
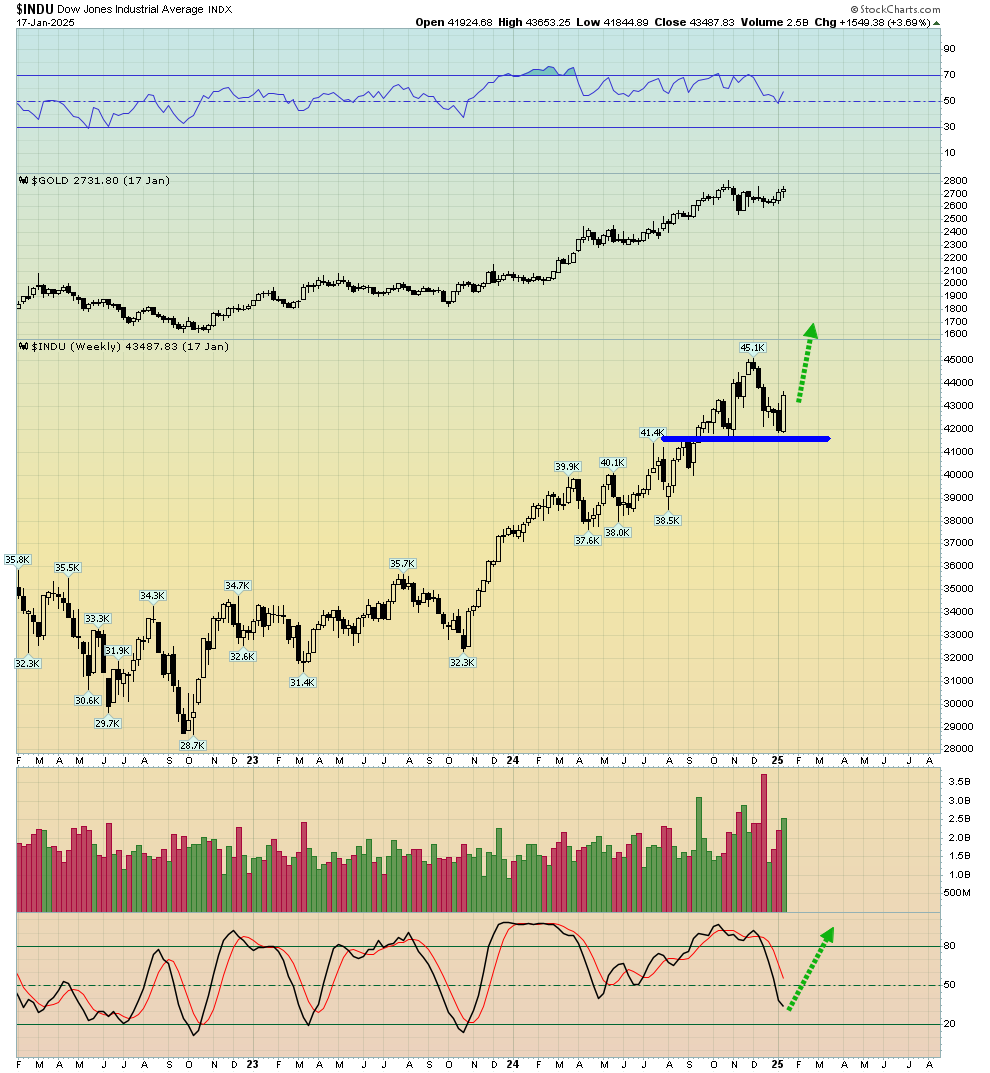
- Note the near-oversold position of Stochastics. It’s occurring with RSI in the 50 area, which is the momentum thrust zone.
- Trump’s reserved approach to tariff taxes doesn’t change the big picture of massive overvaluation for the US stock market. Nor does it change the fact the fiat-oriented population of America is tiny (microscopic, really) in comparison to the enormous gold-oriented populations of China and India.
- The coming decades (and centuries) will be themed much more on those populations (and their focus on gold) than on the citizens of America.
- What Trump’s reserved approach to taxes does do… is buy the US stock market time before a major bear market begins. It could also help to reduce the intensity of the decline.
Double-click to enlarge this daily chart. When Stochastics (14,7,7 series) becomes overbought a dip in the price is typically what occurs next.
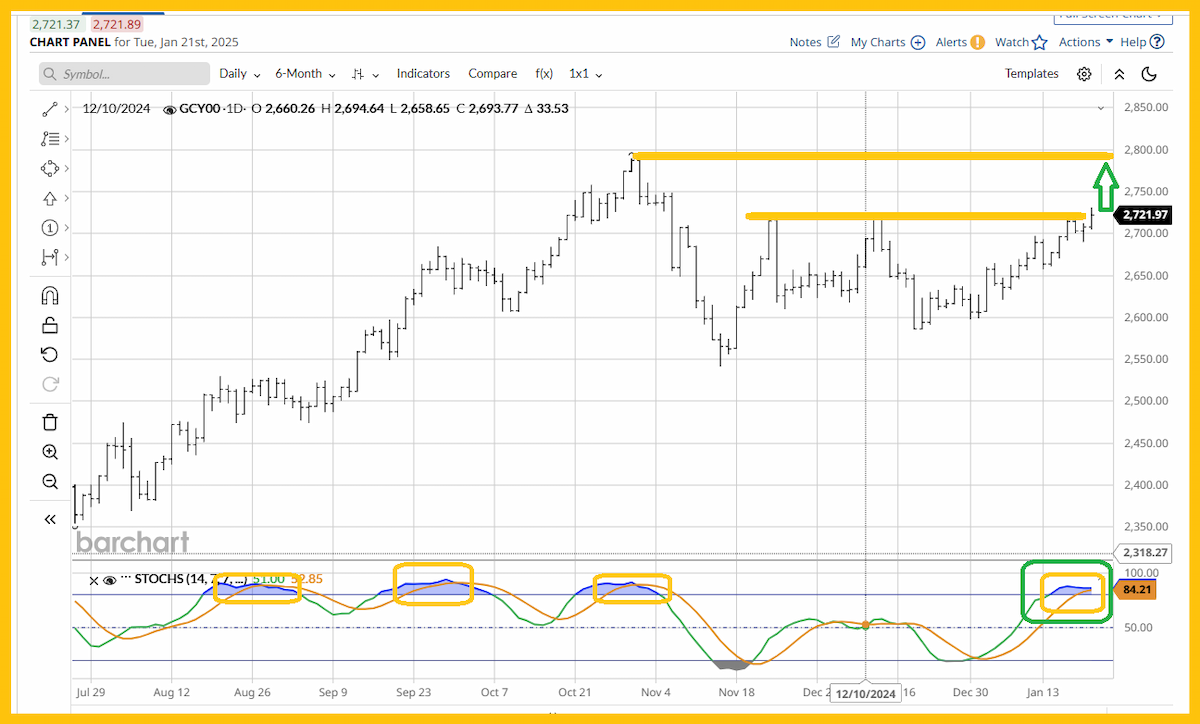
- Having said that, gold’s third arrival at the $2720 marker could be the last one before a surge higher begins… and Stochastics also tends to be overbought when such a key breakout is at hand.
- Also, the price action on the first two arrivals at $2720 was a sharp decline. This time the action is more mellow and that’s bullish.
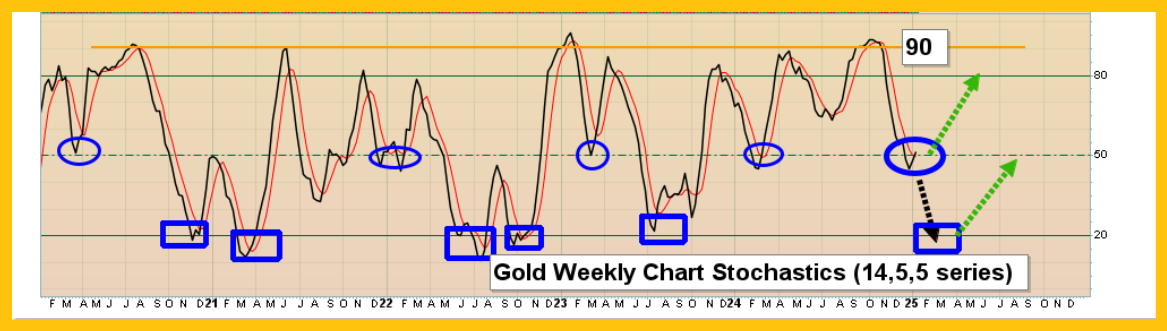
Here’s a snapshot of weekly chart Stochastics (14,5,5 series) for gold. While there could be a dip down to the oversold zone at 20, the sharp buy signal in play at the momentum zone of 50 suggests a major surge higher for the price of gold is most likely.
What about the dollar index (DXY)? Trump’s modest approach to tariffs could see some capital that flowed into America flow back out again.
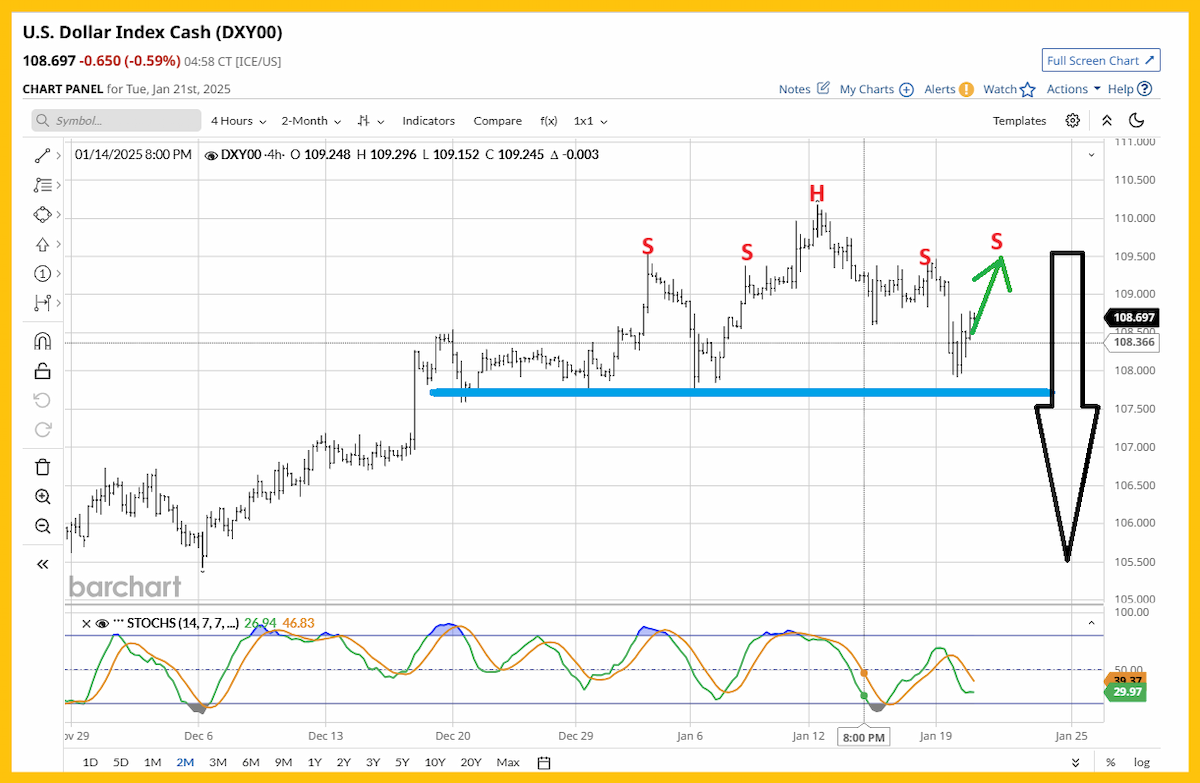
- That’s likely part of what is creating the H&S top on the dollar index. Aggressive tariff tax action, ironically, can increase trade and current account deficits for the US government, as fiat pours into America in a safe-haven trade, driving the dollar higher, driving bond market rates higher…
- Making the huge government debts more difficult to pay.
While the 40year US rates cycle suggests rates bottomed in 2020, and will rise into the year 2060… nothing goes up in a straight line.
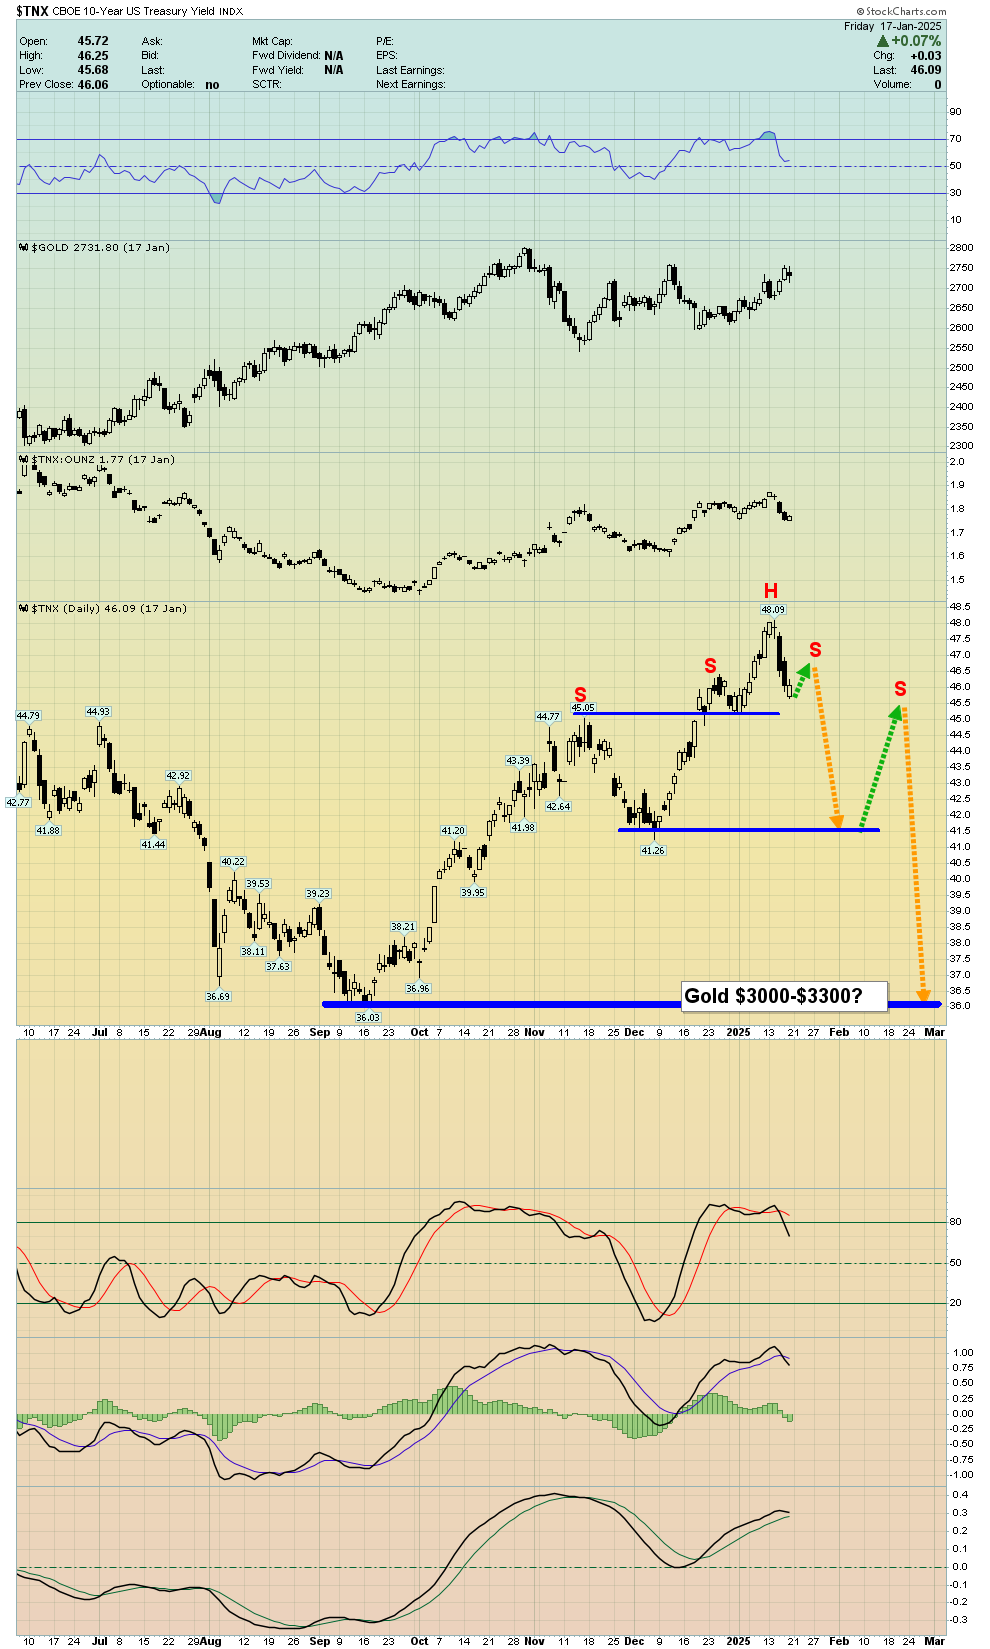
- The “rational exuberance” over Trump 2.0 is likely going to be a factor in the coming dip in rates. That dip is likely to coincide with a surge in gold to $3000-$3300.
What about the miners? This CDNX daily chart is particularly enticing; a breakout above 630 looks imminent!

- A rally in the Dow and gold bullion would likely “seal the CDNX breakout deal”.
When the CDNX moves, it’s a big green shoot for the intermediate and senior producers too. Double-click to enlarge this weekly SGDM chart. A massive saucer pattern is in play.

- Note the fantastic position of the 14,5,5 Stochastics oscillator. It suggests a rally through the $34 saucer highs is going to occur.
For a look at GDX. Double-click to enlarge this weekly chart. It looks at least as good as SGDM, and arguably better.
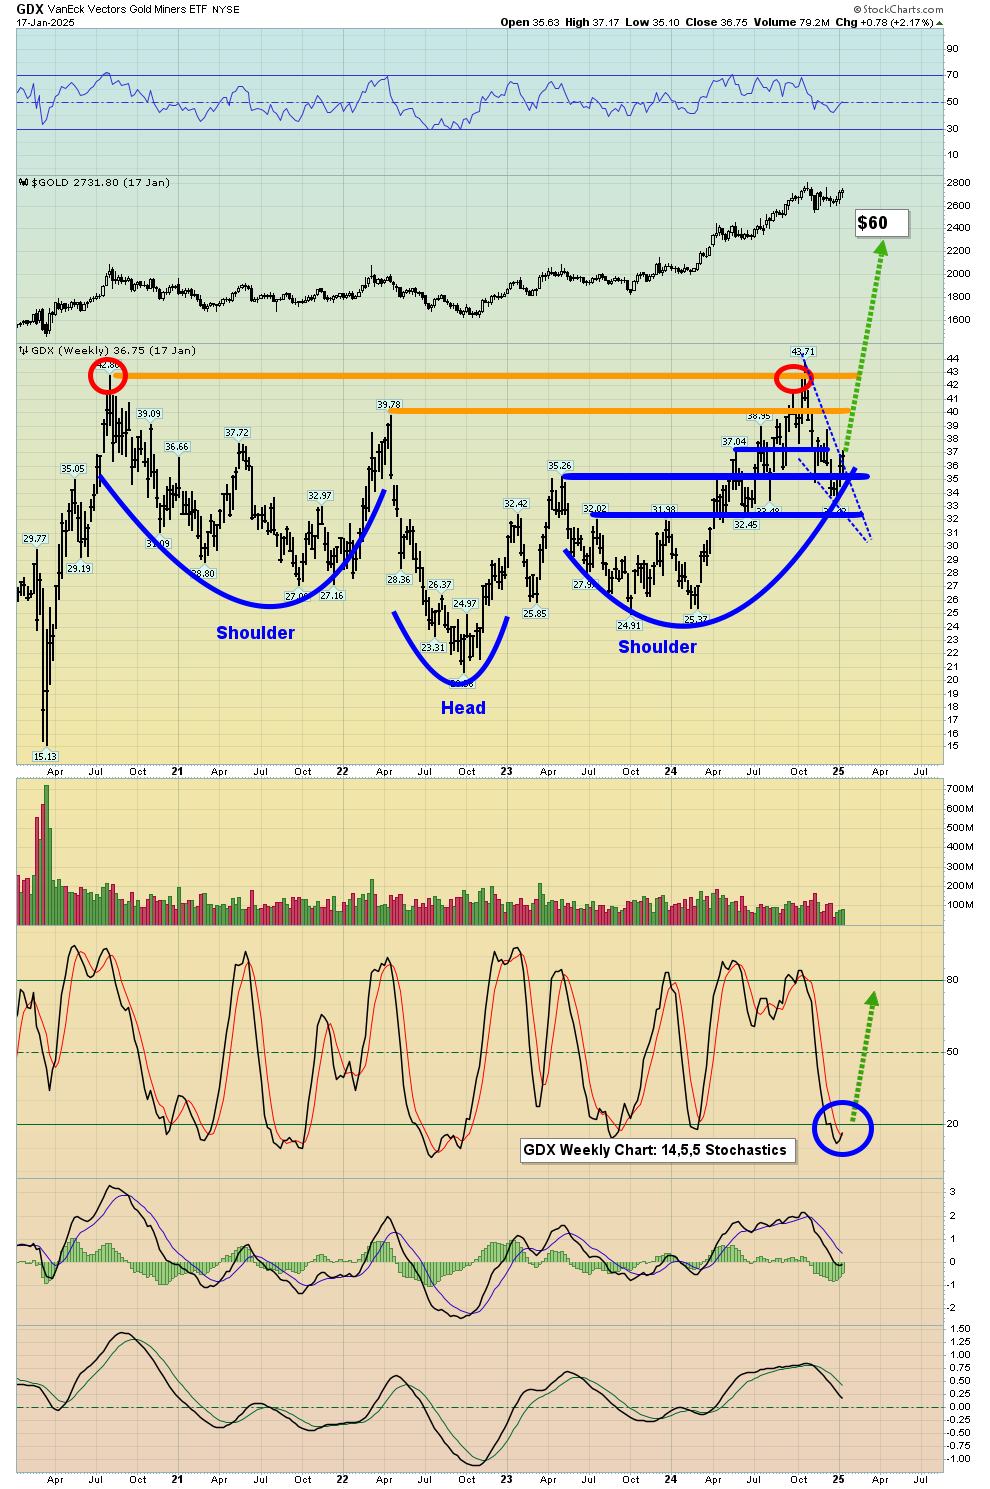
- Note the bull wedge action in play. If a breakout occurs now, it’s occurring at an ideal point of time in the wedge. For bullion bugs, senior producer bugs, and junior bugs… well, simply put, it’s a time for all gold bugs of the world to rejoice!
Thanks!