

Bitcoin continues to maintain its bullish posture, though it has yet to close above $106,000, a key resistance level that has been a challenge since mid-December. RSI has successfully pushed above overhead resistance, and OBV’s moving average is steadily trending higher, reinforcing bullish momentum.

The 4-hour chart shows BTC retreating slightly, which could provide an opportunity for a bounce off previously broken resistance to confirm it as support. Although 4-hour RSI briefly entered overbought territory, the move wasn’t extreme, so there’s little cause for concern.
Bitcoin’s Volume and Market Dynamics
The 4-hour volume has tapered off slightly, likely due to capital rotating into altcoins. However, OBV is back above its moving average and approaching a recent high. A breakout above this level would likely send BTC to a new all-time high, though it could temporarily stall altcoin momentum as traders shift focus back to Bitcoin. Ideally, BTC will remain bullish but stable, allowing altcoins to recover and build strength before the next leg up. If BTC closes above $106K on the daily, it could quickly move toward new all-time highs, reclaiming market dominance in the process.
Ethereum Approaching a Critical Resistance Test

Ethereum is climbing back toward overhead resistance at $3,300. If ETH somehow manages to break through this key level, it would send a strong bullish signal across the altcoin market. Historically, Ethereum has led major altcoin rallies, but its recent performance has been underwhelming. A decisive breakout on ETH would likely reignite momentum across the broader altcoin market.
Stablecoin Dominance Confirms a Bearish Reversal

As expected, stablecoin dominance printed a TBO Close Long signal yesterday, a strong bearish reversal indicator. The next step is for stablecoin dominance to decline back to 5% and continue falling, which would signal decreasing fear and increasing buying activity in the crypto market. A steady downtrend in stablecoin dominance typically aligns with rising prices across Bitcoin and altcoins.
Bitcoin Dominance Forms a Potential Reversal Pattern

BTC.D posted what appears to be a “double top” yesterday, though it hasn’t yet surpassed the all-time high. The chart is clearly respecting the previous local high just under 60% and has started to pull back slightly. The recent surge left BTC.D looking overextended from its daily TBO Fast line, making this small retracement expected. However, a newly identified support line on the daily chart, tested and respected on January 16th and 18th, suggests a possible bullish ascending wedge. If this formation plays out, BTC.D could push much higher, putting additional pressure on altcoins.
Altcoin Dominance Rebounds With Strong Momentum

OTHERS.D had a significant bounce yesterday, gaining 3% while confirming an RSI Reset and breaking above overhead resistance. Despite this strong move, there is still a long way to go before OTHERS.D can reclaim its previous highs. Traders should remain cautious until it fully clears overhead resistance.
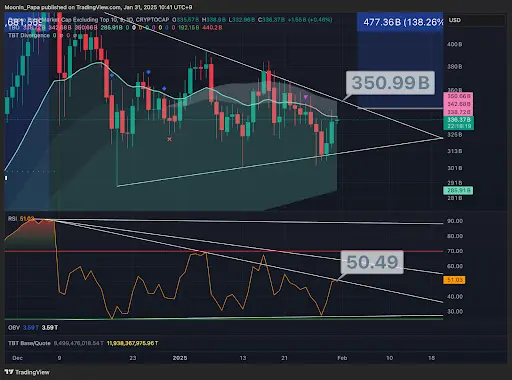
OTHERS Crypto Market Cap Regains Bullish Momentum

The biggest winner yesterday was the OTHERS market cap, which surged 5%, but it met expected resistance at RSI 50.49. For the altcoin market to sustain this recovery, OTHERS must push above $350 billion and continue its upward trajectory.
BVOL7D Confirms the Market Rebound

The BVOL7D indicator has validated last week’s TBO Breakouts as a major reversal signal. As expected, once BVOL7D began falling, altcoins started recovering. Monday’s unexpected market dip provided a strong reset, reinforcing the importance of reviewing these key indicators daily. By consistently tracking these trends, it becomes easier to anticipate shifts in market conditions and navigate the crypto landscape effectively.