

Yesterday was a massive day for crypto, with Bitcoin’s daily candle moving 11% from wick to wick before closing up 3%. The sudden volatility was largely driven by Trump’s proposed tariffs on Mexico, Canada, and China, which created market fear over the weekend. While these tariffs were not unexpected, market makers and exchanges likely took advantage of low liquidity to trigger a cascade of leveraged liquidations.

According to Coinglass, approximately $2.5 billion in leveraged positions were liquidated across exchanges, but Bybit CEO Ben Zhou estimated the real figure to be closer to $8–10 billion. The sheer scale of this liquidation event surpassed both the Terra Luna crash and the FTX collapse in 2022. However, the key difference this time was Bitcoin’s V-shaped recovery, which demonstrated strong resilience and reaffirmed bullish sentiment.
Bitcoin’s Rapid Rebound and Trump’s Influence on the Market
Bitcoin’s rapid bounce was likely fueled by Trump announcing a pause (not cancellation) on the 25% tariff for Mexico. Traditional markets also responded positively, with S&P Futures filling the -1.24% gap left from Friday. Another bullish catalyst came from Senator Cynthia Lummis, who hinted that Trump’s Sovereign Wealth Fund executive order could involve Bitcoin, using the ₿ symbol in her announcement. With previous mentions of a Digital Asset Reserve, this move adds to the growing expectation that Bitcoin and other crypto assets may be formally recognized as part of U.S. reserves.
Despite yesterday’s shakeout, the long-term outlook remains strong. The conviction that 2025 is a top year for crypto remains unchanged, with Bitcoin still on track for new all-time highs later this year.
Bitcoin’s 4H Chart: Volume, OBV, and Market Sentiment

Bitcoin’s 4-hour chart showed massive volume spikes, exceeding $2.8 billion on Binance’s BTC/USDT pair during the dump. This was comparable to major past events like December 7 and January 20. However, OBV on the 4-hour chart looks bearish, signaling that it may take more effort to push BTC back up. On the daily timeframe, however, OBV quickly recovered, demonstrating strong buying demand after the shakeout. The TBO Slow line remains solidly bullish, reinforcing that the macro trend is still up.

Daily RSI rebounded from 26 to 48.89, avoiding a deeper sell-off. The next big challenge for BTC is to push RSI above 50, which will require higher volume and sustained buying pressure. Given the exhaustion from Monday’s dump, this may take some time.
Ethereum’s Struggles: A Targeted Dump?

Ethereum saw a significant drop, with another CME Gap opening at $3,237.50. While Bitcoin rebounded quickly, ETH was hit much harder, leading to speculation that this may have been a deliberate attack. Trump’s crypto-related ventures, such as World Liberty Financial, have publicly accumulated large amounts of ETH. If someone wanted to cause pain to Trump-affiliated projects, dumping ETH would be the logical move.
Despite this, ETH found strong support at the TBO Support level ($2,240), reinforcing that demand is still present. Additionally, the August 2024 Nikkei crash low was respected, showing that the overall structure remains intact. However, history suggests that another dip in 1–2 weeks is still a possibility, similar to what happened after the late summer crash.
Stablecoin Dominance and Bitcoin Dominance (BTC.D)

Stablecoin dominance spiked as high as 6.87%, reflecting the panic in the market. However, RSI on this chart failed to stay overbought, closing below 70, which is a sign of weakness. The expectation is for stablecoin dominance to retreat back toward 5.45% and lower, signaling that risk appetite is returning to the market.

Bitcoin Dominance saw a massive spike to 64.34%, increasing 6% in a single day and printing a TBO Breakout on the daily timeframe. The key test now is whether BTC.D will continue pushing higher or if it has topped out at 76.52 RSI. A reversal in BTC.D would be bullish for altcoins, while a sustained move higher could prolong altcoin underperformance.

The top 10 dominance chart printed an RSI Reset on the daily, a strong buy signal. This suggests that top altcoins are likely to recover from this sell-off, assuming BTC.D doesn’t break out further.
Altcoin Market (OTHERS.D) Took the Biggest Hit

The OTHERS.D chart was brutal, falling all the way to 7.80% dominance, a level not seen since June 2023. Despite the -11% wick, daily RSI closed above 25, confirming that this was a panic-driven sell-off with artificial manipulation. However, TBO Breakdowns have appeared on the chart, which is a bearish signal. While these have been false alarms in the past, traders should remain cautious.
Total Crypto Market Cap: Strength Despite the Sell-off

The TOTAL crypto market cap took a massive hit, yet it recovered quickly, reaffirming that the macro uptrend is still intact. Bullish signals include bouncing back to close green, the daily TBO Slow line continuing upward, and OBV and volume remaining strong. The challenge now is for TOTAL to reclaim the TBO Fast line and break above resistance to confirm a full recovery.

OTHERS market cap, however, hasn’t fully recovered yet, remaining below the daily TBO Cloud. This highlights that altcoins are still weaker than BTC in the short term.
Traditional Finance (TradFi) and the DXY’s Bearish Signal

The DXY (U.S. Dollar Index) dropped as expected, closing red and confirming weakness. This aligns with Trump’s tariff pause and is a positive sign for both stocks and crypto. SPX, DJI, and NDX all gapped lower but recovered slightly, while NVDA took a bigger hit, continuing to fall.

The weekly NVDA chart printed a TBO Close Long, a signal not seen since January 2022, before it crashed -58%. While another major crash isn’t certain, it’s a clear warning sign.

The VIX spiked to 20 but closed lower, indicating that volatility may subside in the short term.

Meanwhile, Gold is the biggest winner, printing three consecutive TBO Breakouts, with price targets at $2,855 and $3,113.
Crypto Altcoin Performance: What to Watch

Solana (SOL) bounced 22% from TBO Support at $176, confirming demand. BNB showed weak demand, failing to close in the green after a -19% crash. DOGE printed an RSI Reset, similar to its December setup, where it later pumped 27%. A repeat could take DOGE to $0.36.

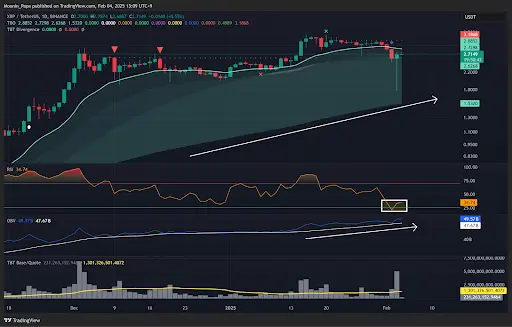
XRP was one of the easiest buys, showing strong demand and fully recovering. The TBO Slow line remains in a powerful uptrend. XMR (Monero) is one of the strongest alts, continuing its uptrend despite market-wide weakness.
Follow the Money: Focus on Strength, Not Bargain Hunting
The most important takeaway from this sell-off is identifying strength. The coins that fully recovered or pumped after the dump are the ones with the strongest demand. These assets are most likely to continue outperforming in the weeks ahead. Rather than chasing cheap, oversold coins, traders should follow the money and focus on assets that rebounded strongly.
While the past few weeks have been exhausting, the long-term outlook remains bullish. This shakeout is likely just another stepping stone on the way to new highs.