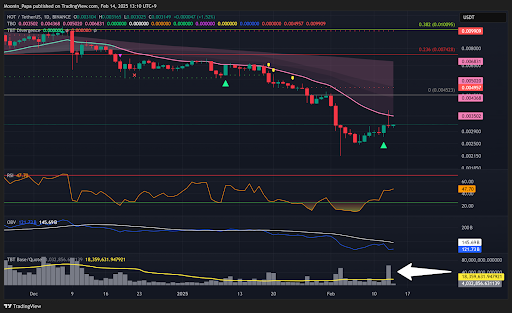
Bitcoin continues to chop sideways, but the key takeaway is that it's not falling lower. This stability is allowing ALTs to regain strength, even though BTC and ETH both closed red on yesterday’s candle. The reality is that we are likely to see mixed red and green days until BTC finally breaks above $100K. ETH is showing a neutral setup with no significant price action at the moment, while stablecoin dominance remains in a holding pattern. A breakout is coming—it’s just a matter of when.
Bitcoin and Stablecoin Dominance Trends Favor a Market Shift
Stablecoin dominance is still chopping on the 4-hour timeframe, but this kind of sideways action usually precedes a sharp move downward.
Meanwhile, BTC.D bounced off the daily TBO Fast Line and has been falling significantly since Monday. The expectation remains for it to continue declining toward the green support level, which would create an opportunity for ALTs to rally further.
The Top 10 Dominance chart is essentially the BTC.D chart but inverted, reflecting strong gains in assets like BNB. This is a good sign, but the confirmation of a larger trend shift will come once this chart closes above the daily TBO Cloud.
OTHERS.D paused slightly yesterday, suggesting that the market is focusing more on Top 10 tokens excluding BTC and ETH, which aligns with BNB’s strength.
BVOL7D continues to drop lower, a necessary move for ALTs to recover further. As long as this continues, the broader crypto market will have more room to push higher.
TradFi and Gold Show Strength, Boosting Market Sentiment
The DXY dropped 0.84%, providing a tailwind for major TradFi indices and stocks. Gold remains in a strong uptrend, with daily RSI still massively overbought as the macro trend continues to push higher. The bullish momentum behind gold is further reinforced by a TBO Breakout Cluster, indicating continued strength.
Altcoins Show Signs of Life as Market Rotation Continues
BNB’s 4-hour chart remains strong after pushing above resistance, but the massive selling volume eight hours ago is concerning. A retest of resistance is likely, but that selling pressure needs to be monitored closely.
XRP is recovering on the daily timeframe and has returned to the daily TBO Fast Line, but the lack of volume is a major issue. This volume weakness is not limited to Bitstamp—it’s also evident on Binance’s XRP/USDT market. Without a significant increase in volume, XRP’s recovery will struggle to continue.
SUI has yet to make a convincing push above resistance, but 4-hour OBV is trending upward despite choppy price action. NEAR is beginning to move up, and resistance at $4.40 will be the next key level to watch. APT is testing the first Resistance Fan line on the daily timeframe, a level that has been difficult to break since mid-January. While daily RSI is increasing, OBV’s moving average is still trending downward, which is a bearish signal.
LTC remains oversold on RSI but lacks strong OBV, indicating a weak uptrend. The 4-hour chart looks equally unimpressive, with significant resistance between $135 and $139. TAO tested overhead resistance earlier this week but failed to break through. The daily TBO Slow Line remains in an uptrend, so the macro trend is still bullish, but price action needs to push above this resistance level for further upside.
Potential Buy Signals and Bullish Divergence Clusters
WIF is looking like a strong entry point, even though it hasn’t yet touched long-term support at 0.536. Daily RSI is beginning to build after an extreme 13-day oversold streak, and despite the significant price drop since February 1st, volume remains strong.
MNT’s 4-hour chart printed two TBT Bullish Divergence signals and a TBO Close Short, suggesting a potential move up to 1.2380 over the next couple of weeks. SONIC is showing a third TBT Bullish Divergence signal on the daily, forming a cluster—this could be a bottoming setup for the chart despite its low volume and weak price action.
NOT printed a TBT Bullish Divergence signal while experiencing an unusual volume spike that exceeded the selling pressure from February 3rd. This suggests a likely bottom. GIGA is sitting at long-term support, making it an interesting chart to monitor.
Final Thoughts and Next Steps
BTC continues to hold steady, which is giving ALTs room to recover. Dominance trends are shifting, with BTC.D and stablecoin dominance falling, while Top 10 and OTHERS.D are beginning to rise. More bullish divergence signals are appearing across the ALT market, suggesting that a broader recovery is underway.
To make the most of this market shift and refine your trading strategy, check out The Complete Cryptocurrency Investor at Mastering Assets.