

Bitcoin continues its sideways consolidation, with the daily TBO Slow Line still trending upward. Daily RSI broke above the first resistance fan line but is struggling to push higher due to yesterday’s bearish close. This marks 12 days of compressed price action within a 2.5% range, a brutal period of chop that is close to resolving. The second resistance fan line is expected to be tested within the next couple of days, and BTC will likely pierce it, pushing up to the final resistance level near $100K.
Despite prior pushes to $107K and $109K, the $100K level remains a key psychological barrier. This prolonged period of chop has been particularly damaging for ALTs and inexperienced traders, but for veteran market participants, it’s nothing new. After BTC recovered from the March 2020 COVID crash, it chopped sideways for 75 days before breaking higher.

That previous cycle saw BTC push to $10K before a 22% rejection, followed by progressively smaller dips and tighter compression. The price eventually traded in a narrow 2% range for ten days before BTC exploded higher. This historical setup is playing out again, with volatility dropping significantly over the last 12 days. The sentiment that BTC has topped out for this market cycle echoes past consolidations, yet history shows that these periods lead to strong breakouts.
Ethereum Approaches Key Psychological Resistance at $3K

ETH printed a TBT Bullish Divergence signal on yesterday’s green close, bouncing into the daily TBO Fast Line for the first time since February 1st. Daily RSI also pushed above overhead resistance, but volume and OBV remain neutral, indicating a lack of strong conviction behind the move. The critical test will come at $3K, a psychological resistance level that intersects with long-term technical barriers. Expect a rejection at first, but yesterday’s divergence is a strong early reversal signal.

ETH/BTC also printed its first-ever TBT Bullish Divergence Cluster. While this is a significant development, both the daily and weekly TBO Slow Lines are still angling downward, signaling that ETH remains in a deep downtrend relative to BTC. RSI support is holding, but ETH/BTC remains heavily oversold on long-term timeframes.
Dominance and Market Rotation Trends

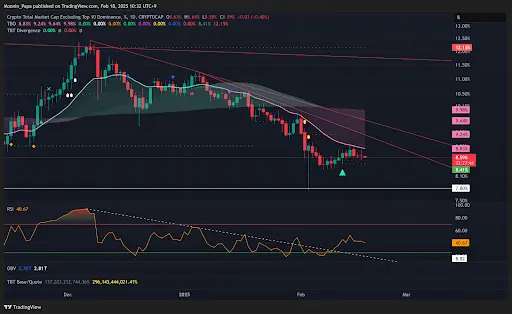
Stablecoin dominance continues to hover above the daily TBO Cloud, signaling a bullish trend. However, since price action remains flat rather than pushing higher, this is actually a bearish signal. Daily RSI failing to reclaim 70 further supports the idea that stablecoin dominance is stalling.

Bitcoin Dominance (BTC.D) has yet to fall inside the daily TBO Cloud but has broken RSI support and printed lower lows. However, this weakness has not yet been reflected in BTC.D’s price action. The goal remains for BTC.D to fall to the green support line at 59%, ideally in tandem with stablecoin dominance.

The Top 10 Dominance chart had a slightly bearish close after briefly poking above the daily TBO Cloud. This is likely due to the uncertainty surrounding SOL. SOL itself has fallen back to daily TBO Support, making this a potential buying opportunity since this level has been respected multiple times since December. Additionally, daily RSI is oversold below 25, signaling that an RSI Reset above 25 is imminent.

OTHERS.D remains below the daily TBO Cloud, but this is unlikely to persist for much longer. A move inside the Cloud would indicate bullish consolidation. Despite several red candles, RSI is holding above the first resistance fan level, a sign of strength. However, OBV for OTHERS is at support, a reflection of weak buying pressure. Consecutive green closes would be required to push OBV higher.
Bitcoin Volatility Set for a Major Move

BVOL7D has entered the bounce zone, meaning Bitcoin volatility is expected to increase significantly. There is no way to determine which direction BTC will move, but when volatility spikes, ALTs tend to lag behind.
Final Thoughts: ETH vs. SOL and Trading Mindset
A clear tug-of-war is developing between ETH and SOL ecosystems. ETH-based coins perform well when ETH pumps, while SOL-based coins struggle, and vice versa. Rather than picking sides, the focus should be on identifying opportunities in oversold charts and trading accordingly.
The best strategy remains:
- Enter trades with a clear plan
- Take profits as prices move up
- Reduce risk by selling small portions along the way
Patience is key. BTC’s breakout is coming, and when it does, the entire market will react accordingly.
To refine your crypto investment strategy and prepare for what’s ahead, check out The Complete Cryptocurrency Investor at Mastering Assets.