

Bitcoin printed two TBO Close Shorts ? on the 4-hour chart within the last 24 hours, signaling a potential bullish reversal. These are some of the strongest confirmation signals for upcoming price moves, and historically, BTC has seen pumps of 8% to 15% following similar signals. If this pattern holds, BTC could move up to $104K, with resistance between $106K and $107K. While a rapid move higher is possible, a slower, more sustained climb would be healthier for long-term momentum.

On the daily timeframe, BTC is also showing signs of strength. RSI bounced off previously broken resistance, reclaiming it as support, and the TBO Cloud currently sits at $99,106. Breaking and holding above this level would be a strong bullish confirmation. The most critical factor remains a daily close above $100K—which would trigger liquidations of short-sellers and likely send the entire crypto market surging 3-5x higher.
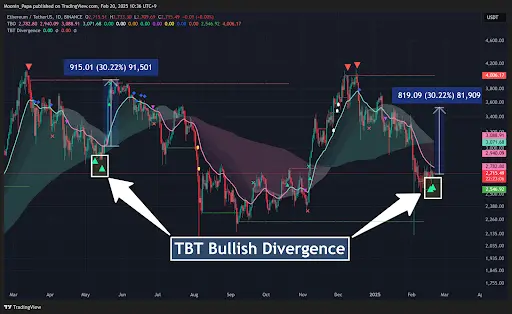
Ethereum Sees Another Bullish Divergence Signal

Ethereum printed its second TBT Bullish Divergence on the daily timeframe, marking a rare "cluster" signal. The last time ETH saw a similar cluster was during the spot ETF announcement, which resulted in a 30% pump. While a repeat move to $3,500 is unlikely in the immediate term, the structure remains highly bullish. Daily RSI is now above resistance, further supporting the potential for a sustained move higher.
Stablecoin Dominance and Bitcoin Dominance Shifting

Stablecoin dominance is beginning to break down, with multiple TBO Close Longs ? on the 4-hour timeframe, signaling that stablecoins are being converted into BTC and altcoins. BTC Dominance (BTC.D) is still holding strong, but no bearish reversal signals have appeared yet. However, TOTAL market cap on the 4-hour chart also printed a TBO Close Short ?, reinforcing the idea of a market-wide rebound.

BVOL7D, which measures Bitcoin’s volatility, has dropped to 4.34, nearing the middle of the Bounce Zone. Given BTC’s bullish reversal signals, a volatility spike is expected soon, potentially driving Bitcoin and alts higher.
DXY Weakens, Stocks Surge

The DXY (U.S. Dollar Index) printed a TBO Open Short ? on the daily timeframe, confirming further downside movement. A weaker dollar is generally bullish for BTC, stocks, and global currencies. On the weekly timeframe, DXY is bouncing off the TBO Fast Line, but if it falls inside the weekly TBO Cloud, the December breakouts could be invalidated, further supporting a bearish outlook for the dollar.

Meanwhile, the S&P 500 (SPX) printed two TBO Breakouts on the daily chart, marking an extremely bullish signal for further continuation. While this isn’t showing up on other TradFi indices yet, SPX's strength could signal broader market optimism.
Select Altcoins Flash Bullish Reversal Signals

Solana (SOL) printed a TBT Bullish Divergence on the 4-hour chart. While the last cluster failed, the previous one in December resulted in a 60% pump. The next couple of days will be critical for confirmation.

XRP is seeing some bullish movement after ETF-related news, with resistance around 2.8251.

MKR printed a TBO Close Short ? on yesterday’s daily close after flashing a TBT Bullish Divergence signal ten days ago. The 4-hour chart is now showing TBO Breakouts—a very bullish combination.
The crypto market is heating up, with BTC and ETH leading the way. If BTC can break above $100K and confirm a daily close, we could see a cascading rally across the board.
Want to master crypto investing? Learn how to navigate these markets with The Complete Cryptocurrency Investor at Mastering Assets.