
(image courtesy of Coinglass)

Another brutal day for crypto as over $1.4 billion in leveraged positions were wiped out, dragging Bitcoin down to $88K. The market has been flooded with speculation on the cause, ranging from Trump’s tariff comments to Spot ETF issuers allegedly selling off holdings. However, the most believable explanation is the influence of major exchanges and market makers coordinating these sell-offs.
Adding to the uncertainty, Senator Cynthia Lummis has been aggressively promoting the upcoming digital asset subcommittee hearing, calling it a "big deal." If the U.S. is preparing for a Bitcoin Strategic Reserve and a Digital Asset Stockpile, it would make sense for institutions to drive prices lower to accumulate at a discount. While there’s no hard evidence of this yet, it remains a possibility worth considering.
Bitcoin Breaks Below the TBO Cloud for the First Time Since October 2024

Bitcoin’s daily close below the TBO Cloud is a major bearish signal. However, the long lower wick on yesterday’s candle suggests strong buying interest at lower levels. While another test of $87K is likely, BTC does not appear to be in free fall. Daily RSI closed at 18.49 but has not yet printed a reset, meaning the selling pressure may not be over just yet.

Historically, after BTC’s RSI drops into heavily oversold territory, there is typically a 2-3 day period of chop before any relief bounce. A newly formed CME Gap at $93,570 provides a strong short-term target, aligning with the TBO Fast Line around $95K.

Volume was notably strong on yesterday’s sell-off, similar to the February 3rd crash. This high volume is a positive sign of demand, indicating that buyers are stepping in. However, OBV breaking support suggests that BTC won’t be making a quick return to $100K anytime soon.
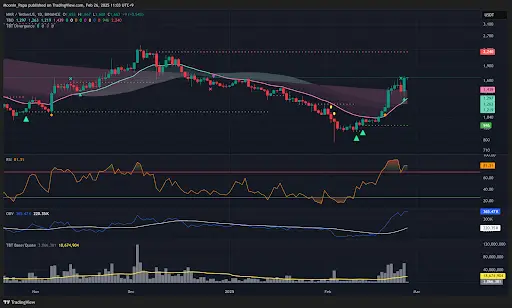
Ethereum’s Strength Amidst the Chaos

Ethereum saw an even stronger recovery than Bitcoin, closing with a 7% lower wick on the daily candle. However, volume wasn’t as impressive as BTC’s, suggesting that more buyers need to step in for a sustainable move higher. A retest of $2,390 is possible, but another CME Gap at $2,623 provides a logical target for an upcoming bounce.

Hidden bullish divergence is forming on ETH’s 4-hour RSI, which made a higher low despite the sell-off. This is a key reversal signal, reinforcing the idea that ETH could outperform BTC in the short term. Supporting this thesis, the ETH/BTC daily chart printed another TBT Bullish Divergence signal. While the TBO Slow Line is still pointing downward, these are the first two such signals ever on this pair, indicating a potential trend shift.
Stablecoin Dominance Surges to 7.21%

Stablecoin dominance hit a new high at 7.21% and printed a TBO Breakout on the daily, along with an RSI peak of 81.20. This is historically bearish for crypto, as it signals that more capital is sitting on the sidelines rather than being deployed into BTC and alts. However, a similar pattern played out in July 2024, where stablecoin dominance spiked before cooling off and falling back down.

The 4-hour chart provides more insight, showing RSI failing to exceed the February 3rd high and already dropping back below overbought levels. This suggests that stablecoin dominance could be losing momentum, a necessary step for the crypto market to stabilize.
Bitcoin Dominance Signals a Shift Toward Altcoins

Despite BTC’s recent dump, Bitcoin Dominance closed red yesterday and printed a TBT Bearish Divergence signal. This is significant because, in a typical market-wide crash, BTC.D should have surged as traders fled alts for BTC. Instead, BTC.D is showing weakness, meaning that market participants are reallocating elsewhere.

The Top 10 Dominance chart confirms this shift. It closed green, up 3.60%—a major sign of strength. RSI support held, and the 4-hour chart shows a higher low on RSI despite the sell-off. This suggests that large-cap alts, rather than BTC, could be leading the next recovery phase.

OTHERS.D, representing the broader altcoin market, also closed up 3.17%, printing another TBT Bullish Divergence signal. While the market remains oversold, this divergence suggests that low-cap altcoins are resisting further downside.

TOTAL crypto market cap fell below the daily TBO Cloud, a bearish confirmation. However, RSI dropped to 21.50, a level historically associated with market reversals. TOTAL2 and TOTAL3 held up relatively well, with OTHERS market cap even closing up 1.33%, a surprising show of strength given the recent bloodbath.
BVOL7D Confirms That Volatility Isn’t Over Yet

BVOL7D surged dramatically yesterday, reaching the halfway point between the Bounce Zone and the Rejection Zone. Historically, this means more volatility is expected in the coming weeks before the market stabilizes. While downside risk remains, the worst of the panic selling may be behind us.
Altcoins Show Signs of Accumulation and Strength

Solana closed slightly green, with daily RSI confirming its massively oversold status. If another drop occurs, $126.62 is the next major support level.

XRP appears to have bottomed, with trading volume exceeding the 30-day moving average and daily RSI bouncing off 25. SUI is printing another TBT Bullish Divergence signal, while OP is forming a Bullish Divergence Cluster.

MKR surged 16%, while NEIRO on ETH printed a TBO Close Short after closing up 22%. Even meme coins are showing resilience—ACT closed up 16% and remains above the daily TBO Cloud, an unusual sign of strength in this environment. PNUT, another meme coin, printed a second TBT Bullish Divergence and gained 16% as well.
Final Thoughts: A Market Pivot Is Coming, But Not Today
This isn’t an immediate reversal, but the signs of a shift in market sentiment are growing stronger. Altcoins are resisting further downside, stablecoin dominance appears to be peaking, and Bitcoin Dominance is showing weakness. These factors suggest that the worst of the sell-off is nearing its end.
However, patience is required. Markets don’t bounce back overnight, and the next phase of recovery will take time to develop. For traders, the focus should remain on accumulating strong positions and using a DCA strategy rather than trying to time an immediate bottom.
If you’re looking to master crypto investing and position yourself for the next rally, enroll in The Complete Cryptocurrency Investor at Mastering Assets.